If your organic visibility around RFM is shallow or scattered, you are not alone. Many brands still underuse RFM analysis, even though it is one of the most reliable and accessible ways to turn first-party data into growth. In this guide, we demystify RFM, show how to operationalize it without technical heavy lifting, and outline how AI makes it predictive and actionable across your entire marketing stack. Along the way, we connect the dots to modern ad platforms, lifecycle messaging, and customer lifetime value.
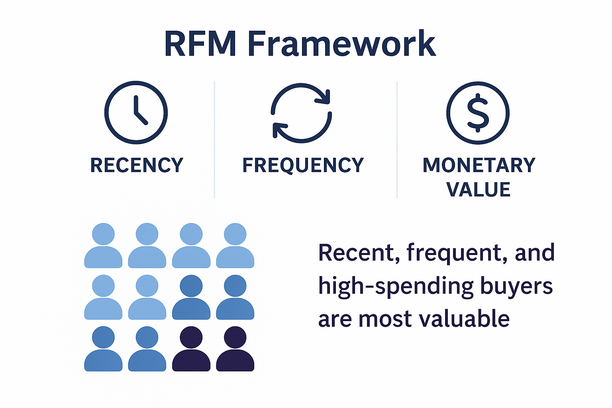
RFM stands for Recency, Frequency, and Monetary value. It is a behavior-based framework that scores customers by how recently they bought, how often they buy, and how much they spend. The idea is simple and battle tested: customers who bought recently, buy often, and spend more are more likely to buy again. That simple truth is the backbone of high ROI audience building, lifecycle marketing, and retention.
Recency captures intent and attention decay. The longer it has been since a customer’s last purchase, the lower the likelihood they will respond to your next campaign.
Frequency indicates habit strength and relationship depth. Repeat purchasing tends to signal satisfaction and product-market fit.
Monetary value separates whales from bargain hunters. Not all repeat buyers contribute equally to profit and LTV.
Academic and practitioner literature has validated RFM for decades across retail, ecommerce, financial services, and media. For a classic reference on RFM’s predictive power in direct marketing and customer value modeling, see this Decision Support Systems paper. For complementary background on customer lifetime value, review the CLV entry on Wikipedia.
How to Calculate and Apply RFM Without Overcomplicating It
You can get meaningful RFM insights with a simple workflow. The principles below apply whether you are running a lean in-house analytics effort, collaborating with an AI consulting partner on data strategy, or using an AI-powered marketing platform.
Define your analysis window and units
Choose a time window that matches your buying cycle. Many ecommerce brands use 6, 9, or 12 months. Seasonal businesses might extend to 18 months. Subscription businesses often index on current tenure.
Define the units. Recency is measured as days since last order. Frequency is the count of orders in the window. Monetary is total revenue in the window or average order value depending on your goals.
Standardize the data
Use unique customer identifiers to merge orders to customers.
Normalize currency, handle returns and cancellations consistently, and decide if shipping or tax should be included in Monetary.
De-dupe orders and remove test transactions.
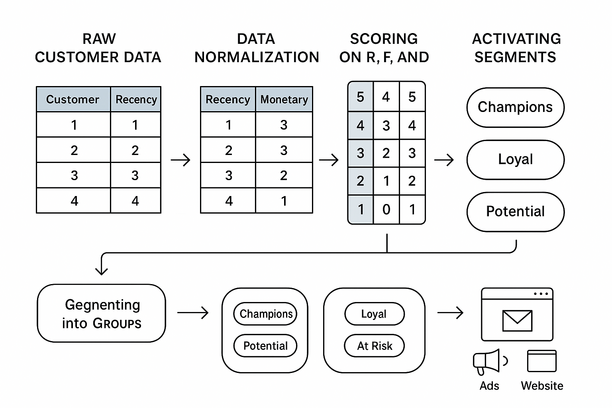
Score each customer on R, F, and M
Split each dimension into buckets such as quartiles or quintiles. For example, with a 1–5 scale, 5 represents top performance for that dimension.
Recency is reverse sorted. The most recent buyers get a 5. The least recent get a 1.
Frequency and Monetary are sorted ascending. The most frequent or highest spenders get a 5.
You can assign scores via quantiles or business thresholds. Quantiles adapt to your data distribution. Business thresholds are useful if you have strategic breakpoints like free shipping tiers or loyalty milestones.
Concatenate or weight the scores
Concatenation preserves dimensional nuance. A customer might have an RFM of 5-3-4. You can store it as 534 and still recover each component.
Additive or weighted scores simplify targeting when one dimension matters more. If your model shows that Recency has the strongest lift for reactivation, you might weight it 50 percent, with Frequency and Monetary at 25 percent each. Use holdouts or A/B tests to validate weights.
Turn RFM scores into segments everyone understands
You do not need dozens of microsegments to start. A simple, shared vocabulary speeds execution:
Champions: High on all three dimensions. Prioritize retention, referrals, VIP access, and premium experiences.
Loyal: Strong frequency and monetary, possibly slightly less recent. Nurture with replenishment, cross-sells, and membership benefits.
Potential Loyalists: Strong recency, growing spend, fewer orders so far. Accelerate the second and third purchase with onboarding flows and targeted offers.
Recent: First-time or very new buyers. Focus on product education, unboxing, and early repeat triggers.
At Risk or About to Sleep: Historically good frequency or spend but recency is sliding. Use timely win-back offers and feedback loops.
Hibernating or Lost: Low across the board. Use low-cost automations, seasonal sales, and suppress from high-cost media buys.
These labels are widely used in analytics education and practice. You can find variations in the literature and in university lecture notes. Wikipedia’s overview provides a neutral starting point.
Activate segments across channels
Lifecycle messaging: Sync segments to your email and SMS platforms for tailored flows.
Paid media: Promote lookalike audiences from Champions and Loyal, suppress Hibernating to save spend.
Website and app: Personalize content blocks, banners, and recommendations by segment.
Service and CX: Route high-RFM customers to priority queues during peak seasons.
Use clean holdout groups when you test treatments by segment.
Track conversion rate, average order value, repeat purchase rate, and downstream LTV.
Recompute RFM regularly. Monthly is common for ecommerce. Weekly for very high velocity stores.
Common Pitfalls to Avoid
Overfitting the matrix. A 5x5x5 grid produces 125 cells. Most brands will not need that level of granularity. Start with 6 to 10 meaningful segments.
Static thresholds in dynamic categories. If your seasonality is extreme, fixed thresholds will misclassify buyers. Use rolling windows and quantiles.
Ignoring margins. Monetary without contribution margin can mislead. Consider product mix and returns where possible.
Confusing demographics with behavior. RFM is behavior first. Demographics can enrich, not replace, what customers do.
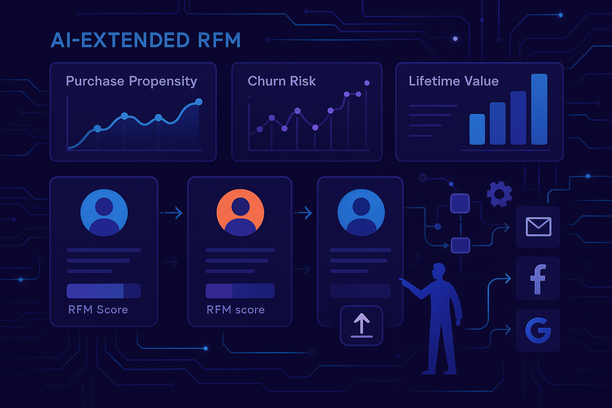
How AI Extends RFM from Descriptive to Predictive
RFM on its own is descriptive. It tells you who has been valuable and engaged. AI makes it predictive and operational at scale, which is why AI strategy and machine learning consulting have become central to modern marketing analytics and martech roadmaps.
From scores to forecasts
Purchase propensity: Train models that predict the probability of a next purchase in the next 7, 14, or 30 days using lagged RFM, product mix, and session data.
Spend projections: Blend Monetary with product affinity and seasonality to forecast order value and LTV. See the CLV overview for concepts and formulas.
Churn risk: In subscription or replenishment models, declining Recency adjusted for expected cadence is a powerful churn signal. Predict it before it is obvious and intervene early.
From static segments to dynamic audiences
Real-time scoring: As new orders sync from your commerce platform, regenerate RFM scores and move customers between segments automatically.
Triggered journeys: When a customer drops from Loyal to At Risk, automatically launch a win-back flow with personalized content.
Media orchestration: Export predictive audiences that mirror your Champions to Meta Ads, Google Ads, and TikTok while suppressing low-value segments from expensive prospecting.
From averages to individualization
Weighted RFM: Let machine learning assign data-driven weights to R, F, and M that best predict the next purchase or LTV for your catalog.
Micro-cohorts: Use clustering on top of RFM to identify emergent groups by cadence, average basket composition, or price sensitivity without exploding your segment count.
Privacy-first targeting: RFM thrives on first-party data. In a world with fewer third-party cookies, segmenting by behavior that you own and control is both compliant and effective.
What This Looks Like in Practice for Ecommerce and Beyond
Ecommerce and DTC
Replenishment and cadence: Combine Frequency and Recency with product type to time reminders and bundles before the customer runs out.
Price and promo sensitivity: Identify buyers who only respond during sales versus full-price Champions. Target accordingly to protect margins.
Catalog expansion: Use Loyal and Potential Loyalists for new category introductions and early access.
Subscriptions
Renewal health: Recency maps to last engagement or shipment, Frequency to successful renewals, and Monetary to plan value plus add-ons. Spot renewal risk and upsell moments.
Onboarding: Move Recent to Potential Loyalists quickly with setup guidance, feature education, and milestone nudges.
B2B and SaaS
Engagement signals: Swap Monetary for contract value, Frequency for usage or logins, and Recency for last active date. Prioritize Customer Success outreach and expansion plays where R or F starts to slip.
Account-based marketing: Build lookalikes from your Champion accounts and suppress churn-risk clusters from high-cost channels to improve ROAS.
Media, travel, and hospitality
Content or stay patterns: Frequency maps to visits or sessions, Monetary to ARPU or booking value, Recency to last trip or binge. Promote relevant packages to high-value recency clusters and reawaken sleepers with timely offers.
How Kuma Operationalizes RFM and Predictive Audiences
RFM is at the heart of how modern growth teams maximize return on ad spend and lifetime value. If you run on Shopify and want to put these ideas to work without building custom pipelines, Kuma gives you an AI-powered environment to segment, predict, and activate audiences using your own first-party data.
With Kuma you can:
Create audiences using behavioral criteria across customers, orders, and products purchased. This includes RFM and richer combinations such as product affinity and order cadence. Age and gender are not inferred by Kuma. If demographic fields exist in Shopify, you can choose to include them.
Sync predictive and custom audiences to Meta Ads, Google Ads, TikTok, Klaviyo, HubSpot, and Pinterest with a few clicks, so your high-value and at-risk segments are always current where it counts.
Analyze campaigns and segment performance, then iterate based on what lifts ROAS, repeat rate, and retention.
Use an AI assistant connected to your Shopify data to explore insights, generate visualizations, and quickly build or refine audiences. This assistant is designed for business owners and teams to analyze data and plan marketing. It is not a customer-facing chatbot.
If you want to learn more about how Kuma helps turn RFM and predictive segmentation into measurable growth, visit Kuma.
Implementation Checklist You Can Start This Week
Align on goals. Is your priority reactivation, second purchase acceleration, or high-value acquisition through lookalikes?
Choose your window. For most stores, start with 12 months. Adjust for seasonality after the first pass.
Set your score scale. 1–5 gives useful granularity without complexity. Use quantiles to assign scores quickly.
Name your segments. Keep 6 to 10 that everyone recognizes: Champions, Loyal, Potential Loyalists, Recent, At Risk, Hibernating.
Wire activation. Map segments to journeys in email or SMS, export to ad platforms, and personalize web modules for at least your top 2 segments.
Measure lift. Use holdouts where practical. Track conversion rate, AOV, repeat rate, and 90–180 day LTV by segment and treatment.
Iterate. Recompute monthly. Tune weights if Recency or Frequency proves more predictive for your category. Retire segments that do not add lift and double down on those that do.
Bringing It All Together
RFM is not a fad or a one-off report. It is the simplest shared language your marketing, growth, and CX teams can use to prioritize attention where it drives the most value. When you combine RFM with predictive analytics and real-time activation, you get a durable advantage in a privacy-first world built on your own data.
Whether you work with internal analysts, partner with data science consulting teams, or want an AI-powered platform that plugs into your Shopify store and existing martech stack, the path is the same: start with clean behavioral data, score and segment clearly, activate consistently across channels, then optimize based on measured lift.
Start simple, activate everywhere, and iterate with evidence, RFM gives you the baseline; AI gives you the edge.
CTA: Want to see what this looks like with your own customer data? Explore how Kuma turns RFM and predictive audiences into measurable gains in ROAS, retention, and LTV. Visit Kuma to get started or contact us for a quick walkthrough.
FAQ – Everything You Need to Know About RFM and Predictive Segmentation
How many segments are too many?
If the team cannot remember them or act on them, it is too many. Start with a small set and expand only when each new segment translates to a distinct action.
Should we use total spend or average order value for Monetary?
Use total spend if your goal is long-term value and retention. Use average order value if your pricing strategy or margin structure requires it. Many brands track both but score on total spend.
How often should we rescore?
Monthly is a good default for ecommerce. Weekly can make sense for very high transaction volume or flash-driven businesses. The more dynamic your category, the more frequently you should refresh.
What about CLV and more advanced modeling?
RFM is a strong baseline and a transparent way to get organization-wide buy-in. As you mature, integrate CLV and predictive propensity to elevate targeting and budget allocation. For conceptual background, see the CLV overview.
Where can I learn more about the underpinnings of RFM?