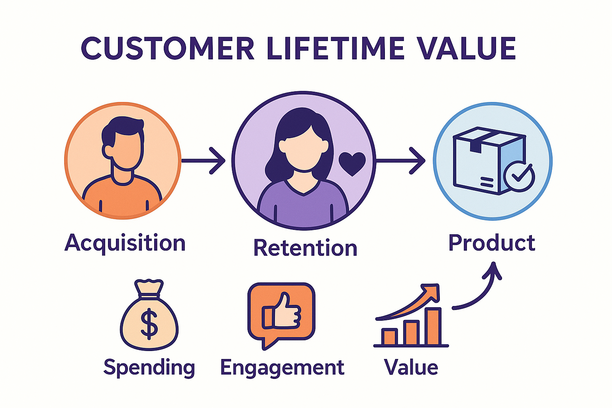
What “clv customer” really means and why it matters
If you typed “clv customer” into a search bar, you’re trying to turn a vague metric into a concrete growth lever. Customer Lifetime Value is not just a calculation. It is a way to align acquisition, retention, and product strategy around the customers who create the most value over time. In this guide, we break down how CLV works, how to measure it, where industry benchmarks sit, and how AI-driven segmentation and predictive analytics help teams lift ROAS, LTV, and retention without wasting budget.
What follows is built for marketing leaders, growth teams, and AI consulting decision makers who need a clear, actionable framework. We will reference neutral sources where helpful, and we will show how to go from measurement to execution using predictive audiences and RFM segmentation. If you want to see how this translates into your stack, you can explore how we approach it at kuma.marketing.
Customer Lifetime Value is the total value a business expects from a customer across the entire relationship. A standard definition is the present value of projected future cash flows, which means you discount future revenue to account for the time value of money. For background on the concept, see Customer lifetime value and Discounted cash flow.
Why it matters:
It links acquisition to retention. CLV shows how much you can afford to spend to acquire a customer and still generate profit. For CAC fundamentals, see Customer acquisition cost.
It informs segmentation. When you know which cohorts drive the most value, you can personalize offers, creative, and timing to match their behavior.
It drives efficient growth. A healthy CLV to CAC ratio typically targets 3:1 to 5:1 depending on model and margin.
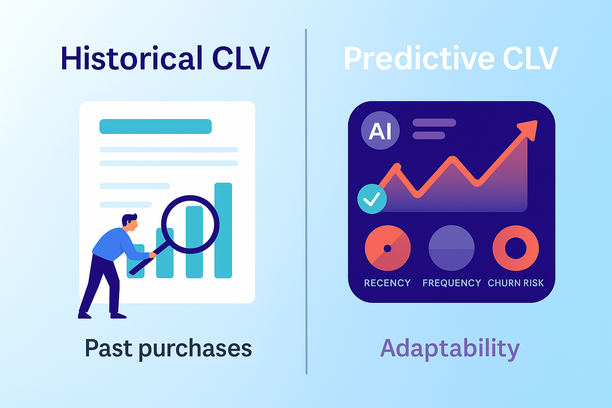
Historical vs predictive CLV
Historical CLV is based on what a customer has already spent. It is reliable and easy to compute but it does not anticipate behavior changes.
Predictive CLV forecasts future value using signals like purchase frequency, AOV, time since last order, product mix, and churn risk. This is where machine learning and AI strategy shine, since predictive models adapt as new data arrives.
Both matter. Historical CLV is your baseline. Predictive CLV directs your next dollar of investment.
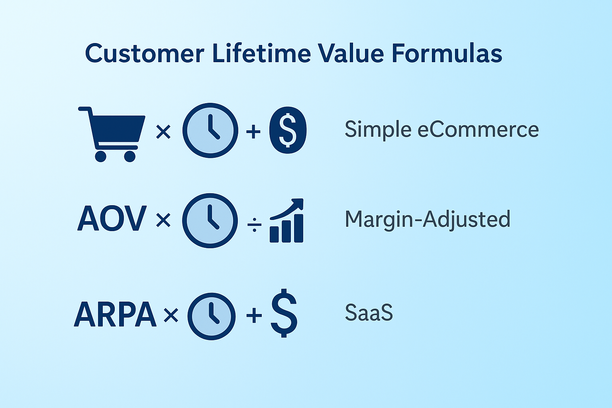
Practical CLV formulas you can use today
There is no single perfect formula. Choose the one that fits your data and model, then evolve it with predictive analytics once you have stable cohort data.
Simple eCommerce approximation
CLV = Average Order Value × Purchase Frequency × Average Customer Lifespan Inputs: AOV (total revenue ÷ number of orders in a time window), purchase frequency (orders per customer per time window), lifespan (average years a customer remains active).
Margin-adjusted CLV
CLV = (AOV × Purchase Frequency × Gross Margin) × Average Customer Lifespan
More realistic, since it focuses on contribution, not top-line revenue.
Subscription or SaaS heuristic
CLV = ARPA × Gross Margin rate ÷ Revenue Churn rate Notes: ARPA is average revenue per account per period. Revenue churn captures downgrades and cancellations. For churn definitions, see Churn rate.
Use the simplest model that protects against overfitting and supports your decisions. Then add predictive features once you’ve validated on cohorts.
Benchmarks and examples by industry
Industry CLV varies widely due to deal size, buying cycle, and retention dynamics. Treat these as directional, not prescriptive:
Architecture firms: often average more than 1 million per client across multi-year projects with add-on engagements.
Business consultancy: commonly six-figure or mid-six-figure CLVs via retainers and multi-project relationships.
SaaS: five- to six-figure CLVs per account depending on ACV and tenure; target CLV:CAC ~3:1 to 5:1.
E-commerce: can appear low per customer at first; scale comes from volume plus replenishment, cross-sell, and subscriptions (e.g., beauty in the low hundreds pre-optimization).
Telecom: 100 per month held for 48 months implies about 4,800 in gross revenue per customer, before costs and discounts.
Insurance and financial services: high CLV from long tenure and cross-sell; models must incorporate claims and risk.
Healthcare consultancies: substantial CLVs due to long relationships and complex engagements.
Creative and digital agencies: typically five-figure to low six-figure per client; upside when one-off projects become managed services.
Your real opportunity lies in measurable lifts from your own baseline via segmentation and retention.
The growth math behind CLV
CLV moves with four levers:
Conversion to first purchase
Repeat purchase rate
Average order value
Relationship length and churn
CLV grows when you: acquire the right-fit audiences, improve onboarding and time-to-first-value, personalize offers and replenishment timing, remove friction early, and expand share of wallet through cross-sell and upsell.
Evidence-backed plays that increase CLV
Nail onboarding to reduce early churn. Poor onboarding can drive roughly 23 percent of churn in certain verticals. A guided first experience, clear value milestones, and proactive outreach in the first 30 days materially improve repeat rate.
Invest in customer experience. Customers who rate experiences 5/5 are more likely to purchase again, and around 80 percent of highly satisfied consumers tend to increase spend over time. Treat CLV as the KPI for your CX program.
Build loyalty programs with a real value exchange. More than 90 percent of companies see positive ROI when rewards, early access, and members-only benefits align with customer goals. Keep it simple and transparent.
Use referral and advocacy programs. Referrals lower CAC and often convert into higher-than-average CLV. Make the mechanic simple and the reward clear for both parties.
Personalize with behavioral data, not guesswork. Behavioral and RFM segmentation outperform broad persona assumptions. For a primer, see RFM segmentation.
Get proactive on support. Identify churn precursors (e.g., sudden drop in engagement, delayed replenishment, spike in support contacts). Proactive outreach and recovery offers preserve value before attrition.
Close the loop on feedback. Collect feedback across touchpoints, act on it, and communicate changes. This builds trust and retention.
Master replenishment and timing. For replenishable goods, predicted reorder windows and automated reminders unlock repeat revenue without heavy discounting.
From measurement to action: a CLV operating system for marketing leaders
1) Unify the data you already have
Start with Shopify and your marketing stack. Pull orders, products, customer profiles, and campaign data into a single view. Build baseline cohorts by acquisition month, first product purchased, and channel. Track their repeat rate, AOV, and CLV over 3, 6, and 12 months.
2) Compute both historical and predictive CLV
Historical CLV gives you truth. Predictive CLV allocates the next dollar. Use features like recency, frequency, monetary value, product category, discount depth, and time between purchases. Keep a simple baseline formula in production while you pilot a predictive model in parallel; reduce overfitting with cross-validation on older cohorts.
3) Segment for action, not vanity
Create segments such as High predicted CLV, Mid-value with high growth potential, At-risk, New-to-file with high early promise, and Lapsed but high historical value. Align each segment to a clear playbook:
• High predicted CLV: early access, premium support, higher bid caps in paid media
• At-risk: proactive outreach, friction removal, service recovery
• Lapsed: reactivation with relevance, not just discounts
4) Sync segments everywhere your customers are
Push predictive and custom audiences to Meta Ads, Google Ads, TikTok, Pinterest Ads, Klaviyo, and HubSpot. Use value-based lookalikes from high predicted CLV segments to improve ROAS. In email and SMS, personalize cadence and content by RFM tier and predicted reorder windows.
5) Create a test-and-learn engine
Every program gets a hypothesis, test window, and success metric tied to CLV or its leading indicators. Rotate two-week and four-week experiments across ads, onsite, and CRM to compound wins. Instrument everything so results update in real time.
6) Govern privacy and security
Centralize data with privacy-by-design. You can compute RFM and predictive CLV without third-party cookies by focusing on first-party transaction and engagement data. Keep data minimization and purpose limitation front and center as you design models.
7) Tie it back to finance
Track CLV to CAC ratio by channel and creative theme. Sense-check against margins and cash cycle. For payback literacy, see Customer acquisition cost.
How AI elevates the CLV playbook
Signal extraction: Models detect micro-patterns that correlate with higher second-order rates or churn risk, improving predictive CLV and audience quality.
Speed: Predictive audiences refresh automatically as customer behavior changes, keeping campaigns and flows aligned without weekly manual exports.
Personalization at scale: Behavioral clusters map to creative, offer, and timing without bloating your workflow.
This is why AI and ML are now standard for growth-stage and enterprise teams. The value shows up in paid media efficiency, higher repeat rates, and healthier cash conversion.
Where Kuma fits in your CLV strategy
Predictive and custom audiences built from your customers, orders, and products purchased. No reliance on age or gender, just the signals you already own.
Effortless syncing from Shopify to Meta Ads, Google Ads, TikTok, Pinterest Ads, Klaviyo, and HubSpot so your segments are always in market.
RFM segmentation and insights that improve retention strategies and LTV.
A chatbot for business owners and marketers that connects to Shopify data to analyze cohorts, generate tailored marketing ideas, create graphs, and help build high-converting audiences. This is not a customer-facing chatbot.
Campaign analytics that tie your programs back to CLV and retention.
If you want to see how this works in your stack, learn more at kuma.marketing.
A concise checklist to boost CLV in the next 90 days
Calculate your current CLV and CLV:CAC by acquisition channel. Set a target ratio.
Build RFM tiers and baseline cohorts by first product and first channel.
Launch predictive CLV scoring on historical data. Validate on newer cohorts.
Create high-value lookalike audiences and suppress low-value segments in paid media to lift ROAS.
Add replenishment reminders and winback journeys triggered by predicted reorder windows and lapse risk.
Implement a simple loyalty or members program with clear benefits that match your unit economics.
Establish proactive service SLAs for top segments. Monitor at-risk signals and intervene quickly.
Align creative and offer strategy by segment, not by broad persona. Test frequency and sequencing as much as content.
Review privacy practices and ensure first-party data is the backbone of your modeling.
Report CLV monthly at the executive level, with actions and learnings attached.
Common pitfalls to avoid
Chasing average CLV. Averages hide the distribution. Manage by segments and cohorts.
Ignoring margin. Always adjust for contribution margin and returns to avoid unprofitable growth.
Overcomplicating models too early. Start simple, ship value, then iterate.
Static audiences. If high-value segments aren’t refreshing continuously, performance decays.
Discount-only tactics. Discounts can train behavior. Use value, timing, and relevance first.
Bringing it all together
CLV is the bridge between your marketing, product, finance, and customer experience strategies. Use historical CLV to know where you stand. Use predictive CLV to decide what to do next. Combine both with RFM segmentation and channel-wide syncing so your best customers see the right message at the right time. Treat CLV as your north star and your operating system, not a vanity metric.
If you want to move from theory to practice, see how predictive audiences, RFM insights, and channel syncing can lift your ROAS and retention. Explore the approach and request a walkthrough at kuma.marketing. Our team can help you connect your data, segment your best customers, and operationalize CLV across Meta Ads, Google Ads, TikTok, Pinterest Ads, Klaviyo, and HubSpot.
FAQ – Everything You Need to Know About CLV and AI-Powered Segmentation
What is Customer Lifetime Value (CLV)?
CLV is the total value a business expects from a customer across the entire relationship. It’s often modeled as the present value of projected future cash flows. For background, see Customer lifetime value and Discounted cash flow.
What’s the difference between historical and predictive CLV?
Historical CLV uses realized spend and is stable for reporting. Predictive CLV forecasts future value using behavioral and transaction signals (recency, frequency, monetary value, product mix, churn risk). Use historical CLV as the baseline and predictive CLV to allocate budget.
What CLV to CAC ratio should I target?
Many models target a CLV:CAC between 3:1 and 5:1, adjusted for margins and cash cycle. Learn more about CAC fundamentals via Customer acquisition cost.
How do I calculate CLV for eCommerce vs. SaaS?
For eCommerce, a practical approximation is CLV = AOV × Purchase Frequency × Average Customer Lifespan (margin-adjust it for realism). For SaaS or subscriptions, a common heuristic is CLV = ARPA × Gross Margin rate ÷ Revenue Churn rate. For churn definitions, see Churn rate.
What is RFM and why is it powerful?
RFM segments customers by recency, frequency, and monetary value. It outperforms broad personas for predicting repeat behavior and tailoring offers. See RFM segmentation for a primer.
How does AI improve CLV and retention?
AI helps you extract subtle signals, refresh audiences automatically, and personalize at scale. This boosts ROAS, repeat purchase rate, and cash conversion by targeting the right message, offer, and timing for each segment.
Do I need third-party cookies to compute predictive CLV?
No. You can compute RFM and predictive CLV from first-party transaction and engagement data. Prioritize privacy-by-design, data minimization, and clear purpose limitation.
What are quick wins I can ship in 90 days?
Calculate CLV and CLV:CAC by channel, build RFM tiers, launch predictive scoring, create high-value lookalikes, add replenishment and winback flows, and align creative and offers by segment. Report CLV monthly with actions and learnings attached.