Product Journey: Analysis to Boost Your Shopify Revenue
Why Understanding the Product Journey on Shopify Is Essential
Analyzing the customer journey addresses several key challenges for Shopify merchants:
- Leverage your existing customers: Converting a loyal customer (60–70%) is far easier than acquiring a new one (5–20%). Focusing on retention improves ROI without increasing acquisition costs.
- Strengthen customer loyalty: A 5% increase in retention can boost profits by 25–95%. Identifying loyalty-driving products enables strategies like subscriptions or targeted reactivation campaigns.
- Increase cross-sell revenue: Product recommendations can raise average order value by 20–30%. By spotting frequently purchased-together items, you can drive additional sales effortlessly.
- Optimize product and marketing decisions: The product journey reveals what drives repeat purchases. Data guides decisions—what to promote, which offers work, which collections are profitable—saving you time and effort.
How Does Kuma Analyze the Product Journey?
Kuma aggregates your Shopify data to deliver actionable insights. Product journey analysis consists of several key features working together to guide you:
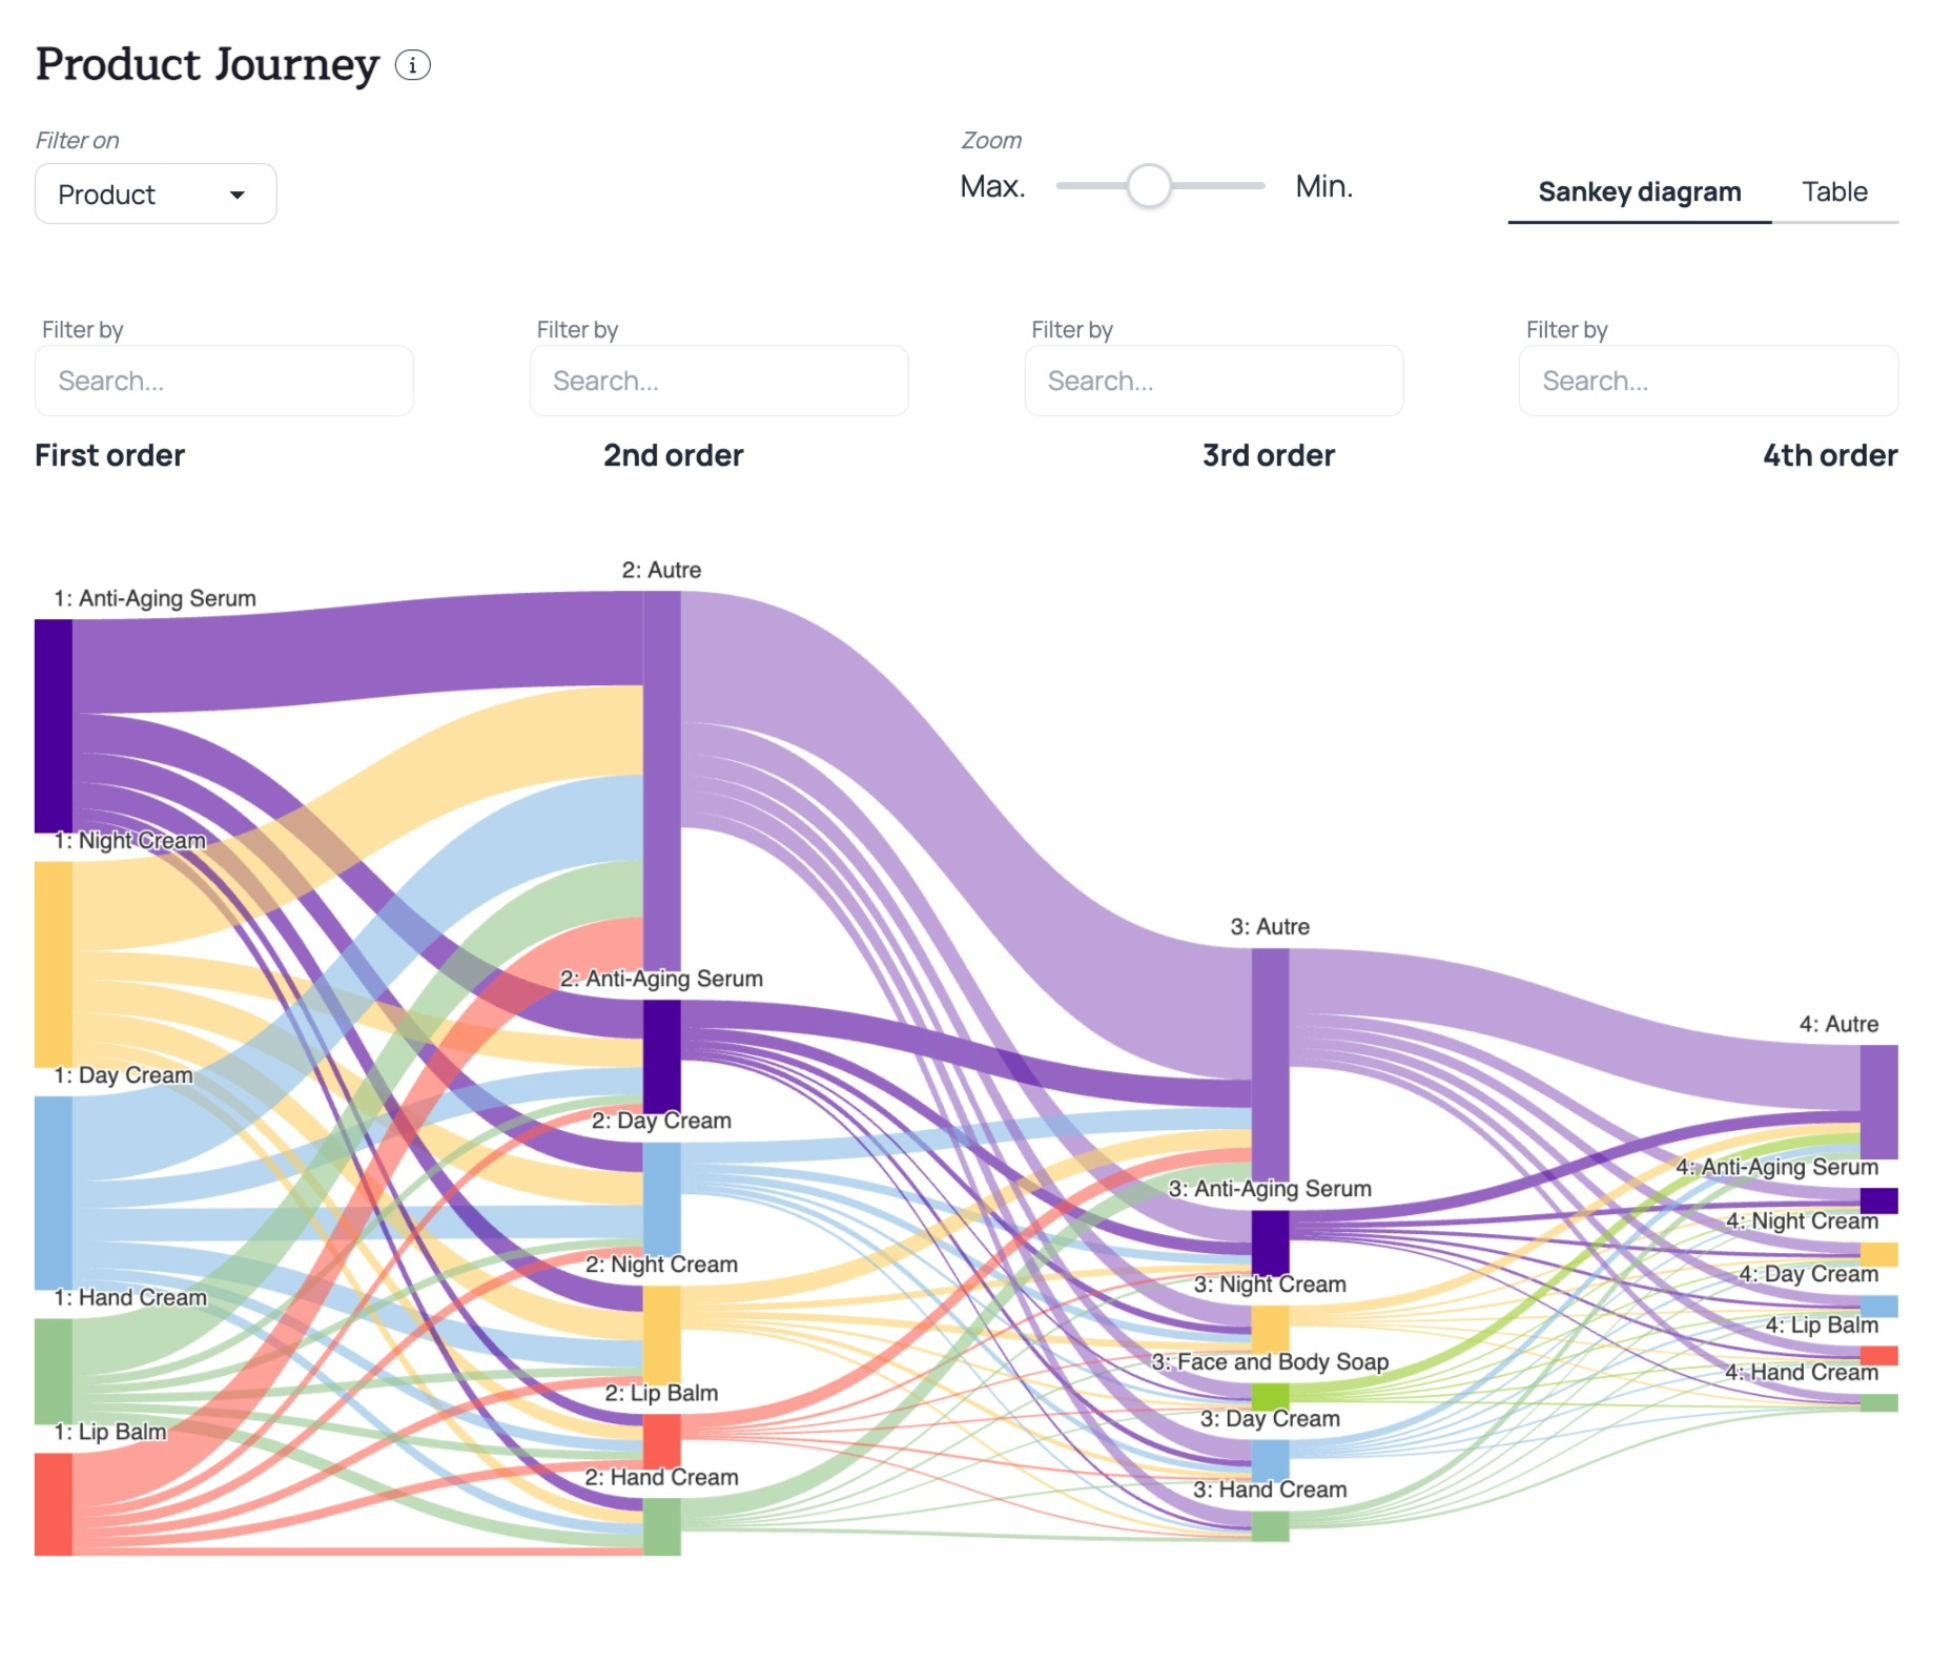
Visualize Your Customers’ Product Journey on Shopify
With its interactive Sankey diagram, Kuma allows you to visually analyze the product and customer journey on Shopify, order by order. This tool highlights product transitions from the first purchase to repeat orders, revealing the most common sequences.
On the chart, each colored flow represents the transition from one product to another. For example, a customer who bought an anti-aging serum on their first purchase is likely to reorder it in the future, marking it as a strong retention driver. These sequences are key to understanding buying behavior, spotting cross-sell opportunities, and optimizing loyalty strategies.
With this dynamic purchase journey map, you can instantly identify:
- Products that trigger a chain of purchases;
- Natural product combinations for bundles or personalized post-purchase emails;
- Products rarely followed by repeat purchases, signaling potential engagement or satisfaction issues.
👉 Maximize your Shopify data with Kuma’s Sankey diagram to boost conversions, repeat purchases, and customer lifetime value.
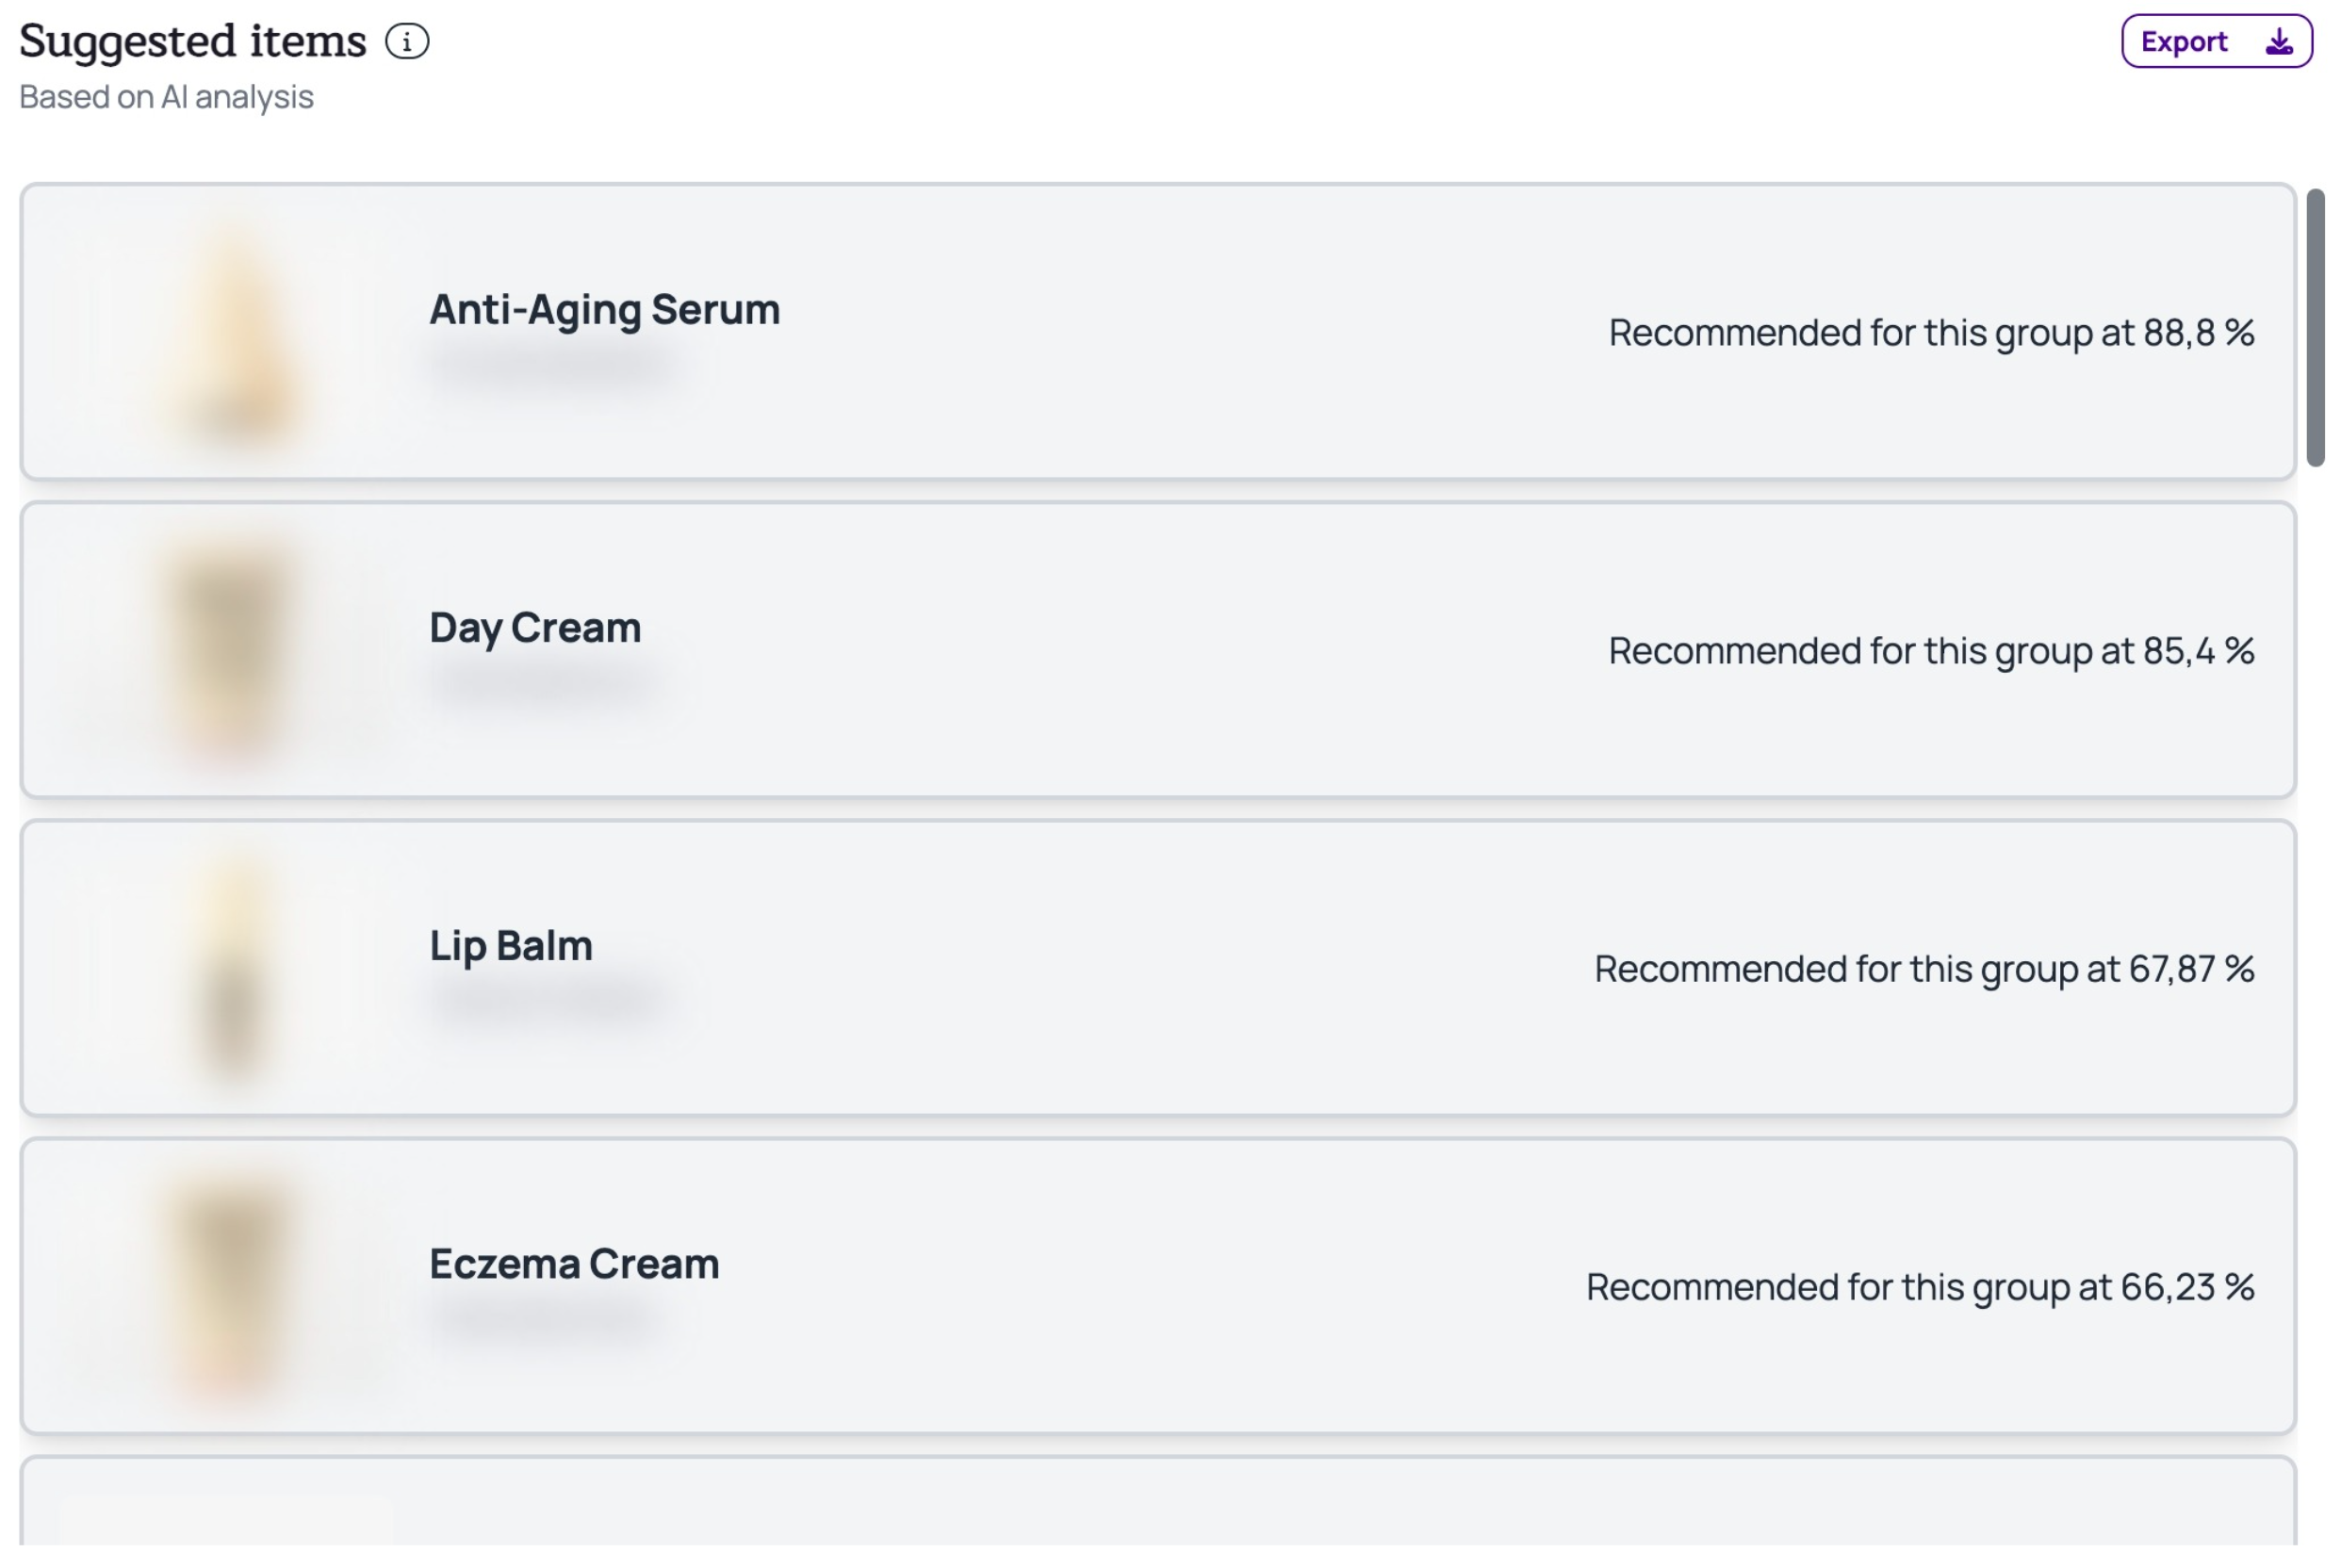
🎯 Personalized Product Recommendations for Every Segment
At Kuma, product recommendations go beyond simple correlations—they’re powered by an advanced analysis of real purchasing behavior in your Shopify store.
Thanks to its AI, Kuma identifies products that are:
- frequently purchased together,
- popular among your most loyal customers,
- and driving the highest purchase volumes and added value.
Result: each customer group receives the most relevant product suggestions based on their purchase history.
Kuma’s AI helps you:
- identify your true loyalty-driving products,
- feature the right items in your marketing campaigns,
- and optimize cross-sell and post-purchase email offers.
👉 And to streamline activation, all product recommendations are exportable in CSV format—saving you time when integrating them into your ad campaigns (Meta Ads, Google Ads, Klaviyo, etc.).
No more guesswork: make data-driven decisions powered by your best customers’ behaviors.
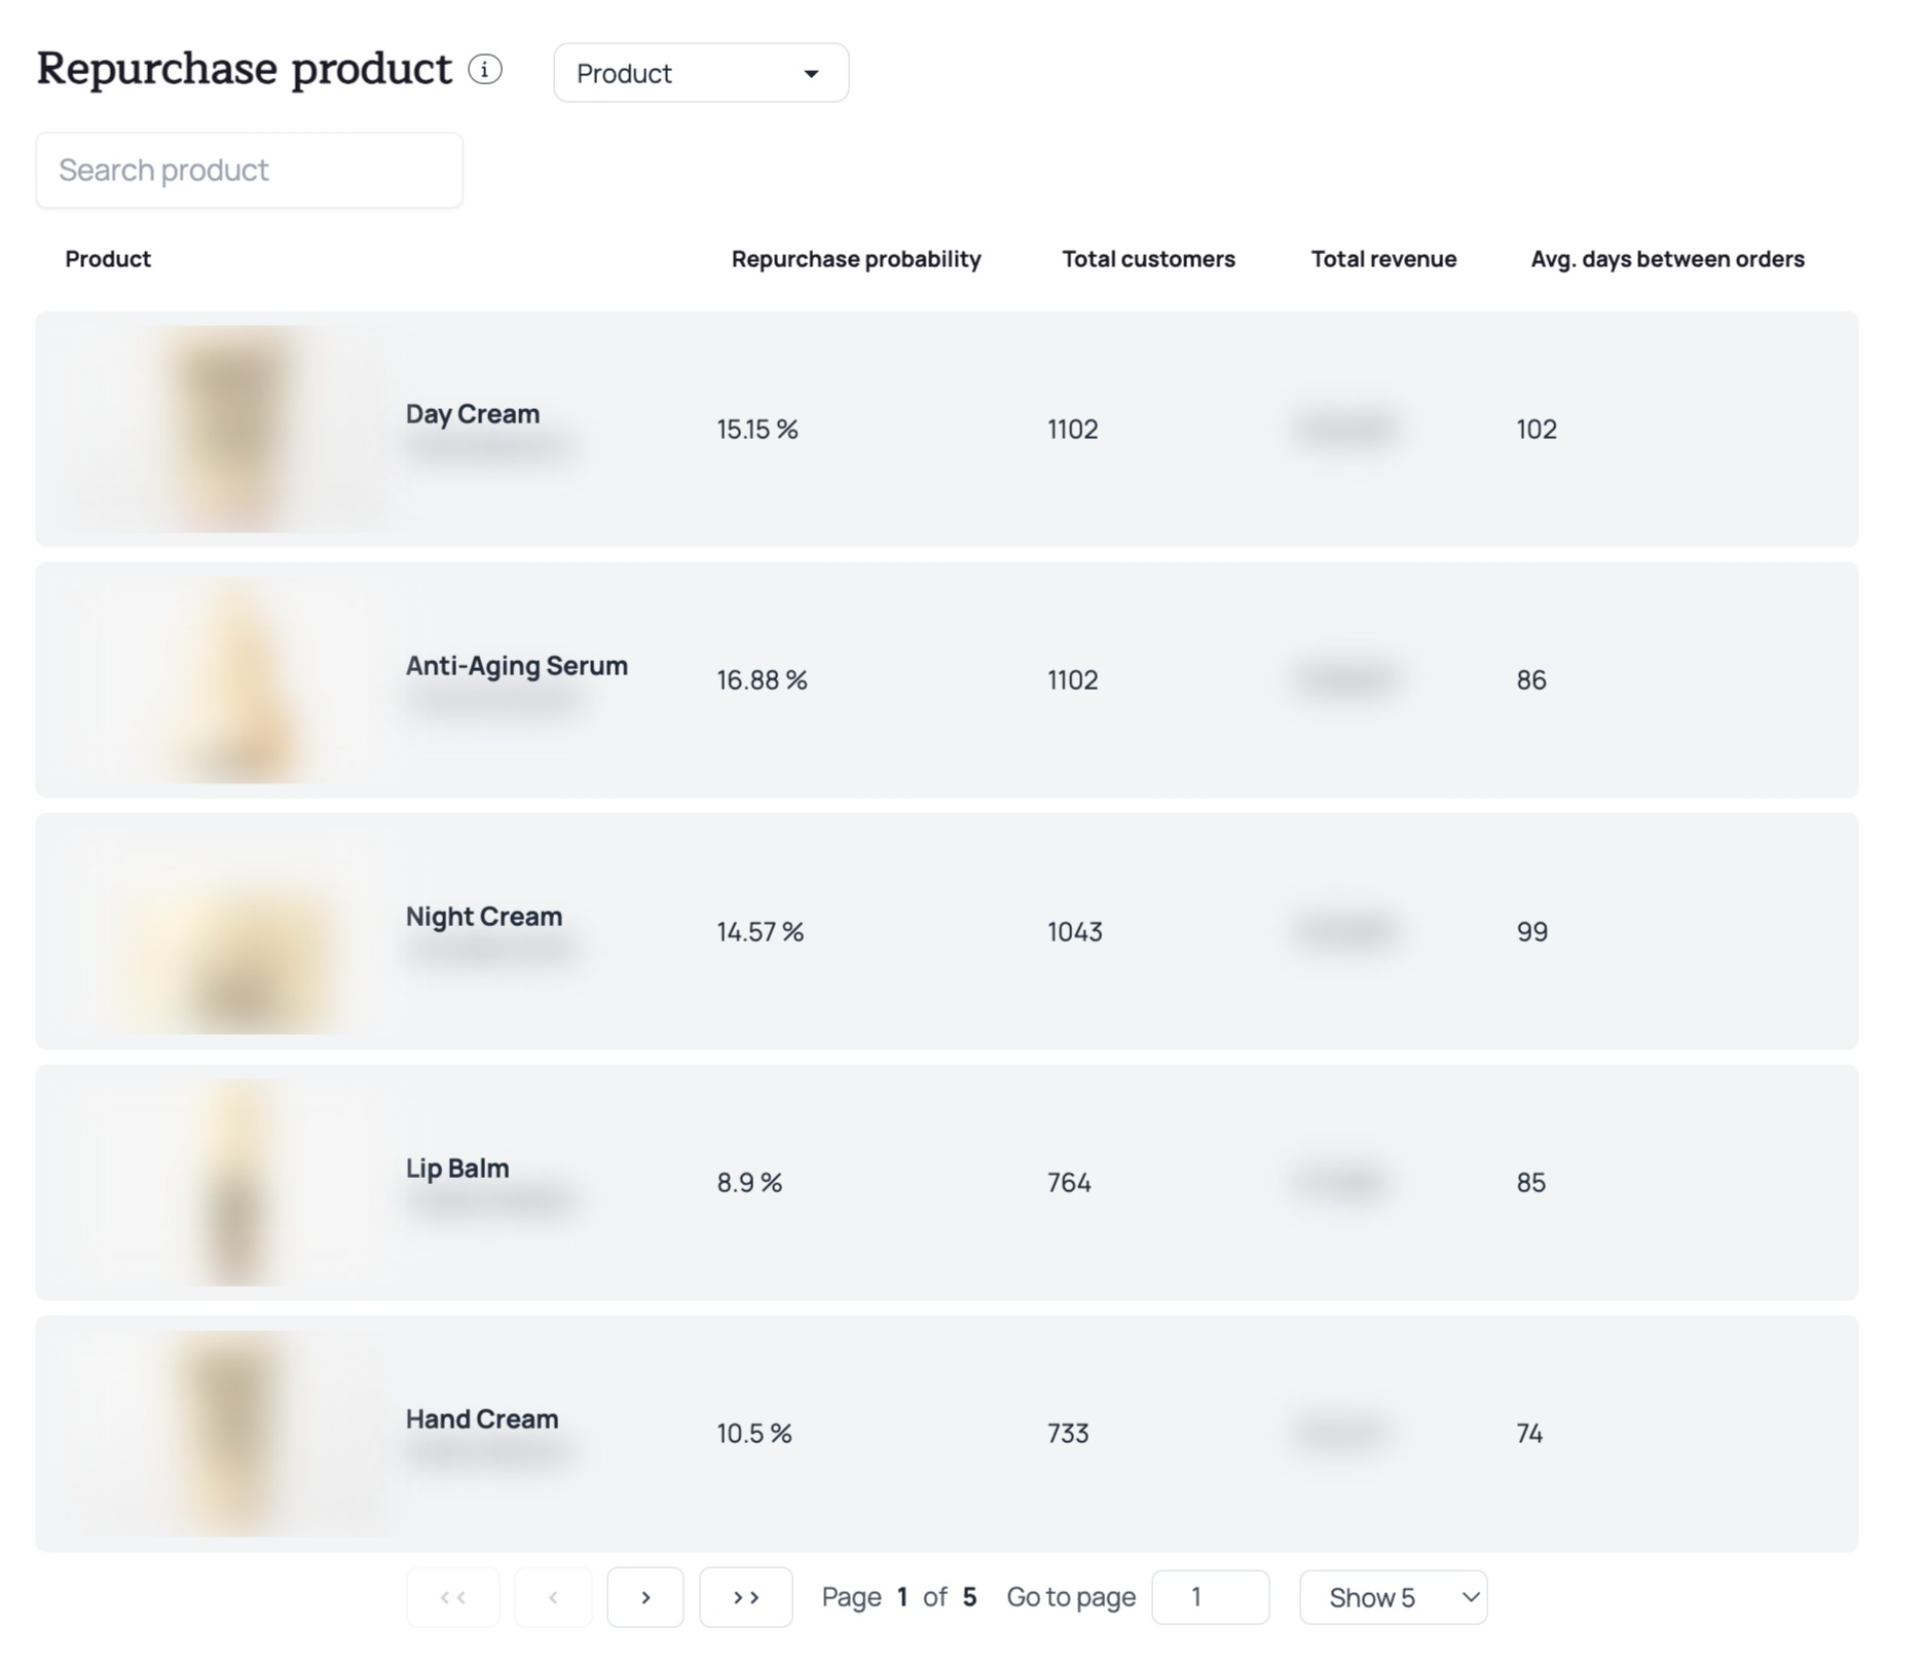
🔁 Product Repurchase: Anticipate the Right Moments to Retarget
With Kuma, you get key indicators to understand each Shopify product’s repurchase dynamics. The app calculates not only the repurchase probability but also the average days between orders—essential for effectively managing:
- your automated retargeting campaigns,
- and your inventory management.
By understanding the unique buying cycles of each product, you can time your marketing and logistics perfectly. A product with regular repurchases can be promoted just before the next expected need, while short-cycle items require closer monitoring.
Mastering the repurchase moment helps you:
- Improve customer retention with timely, relevant retargeting;
- Optimize product logistics to avoid stockouts or overstocking;
- And align marketing efforts with real consumption patterns.
👉 These insights let you act at the right time, with the right message, delivering a smoother, more profitable customer experience.
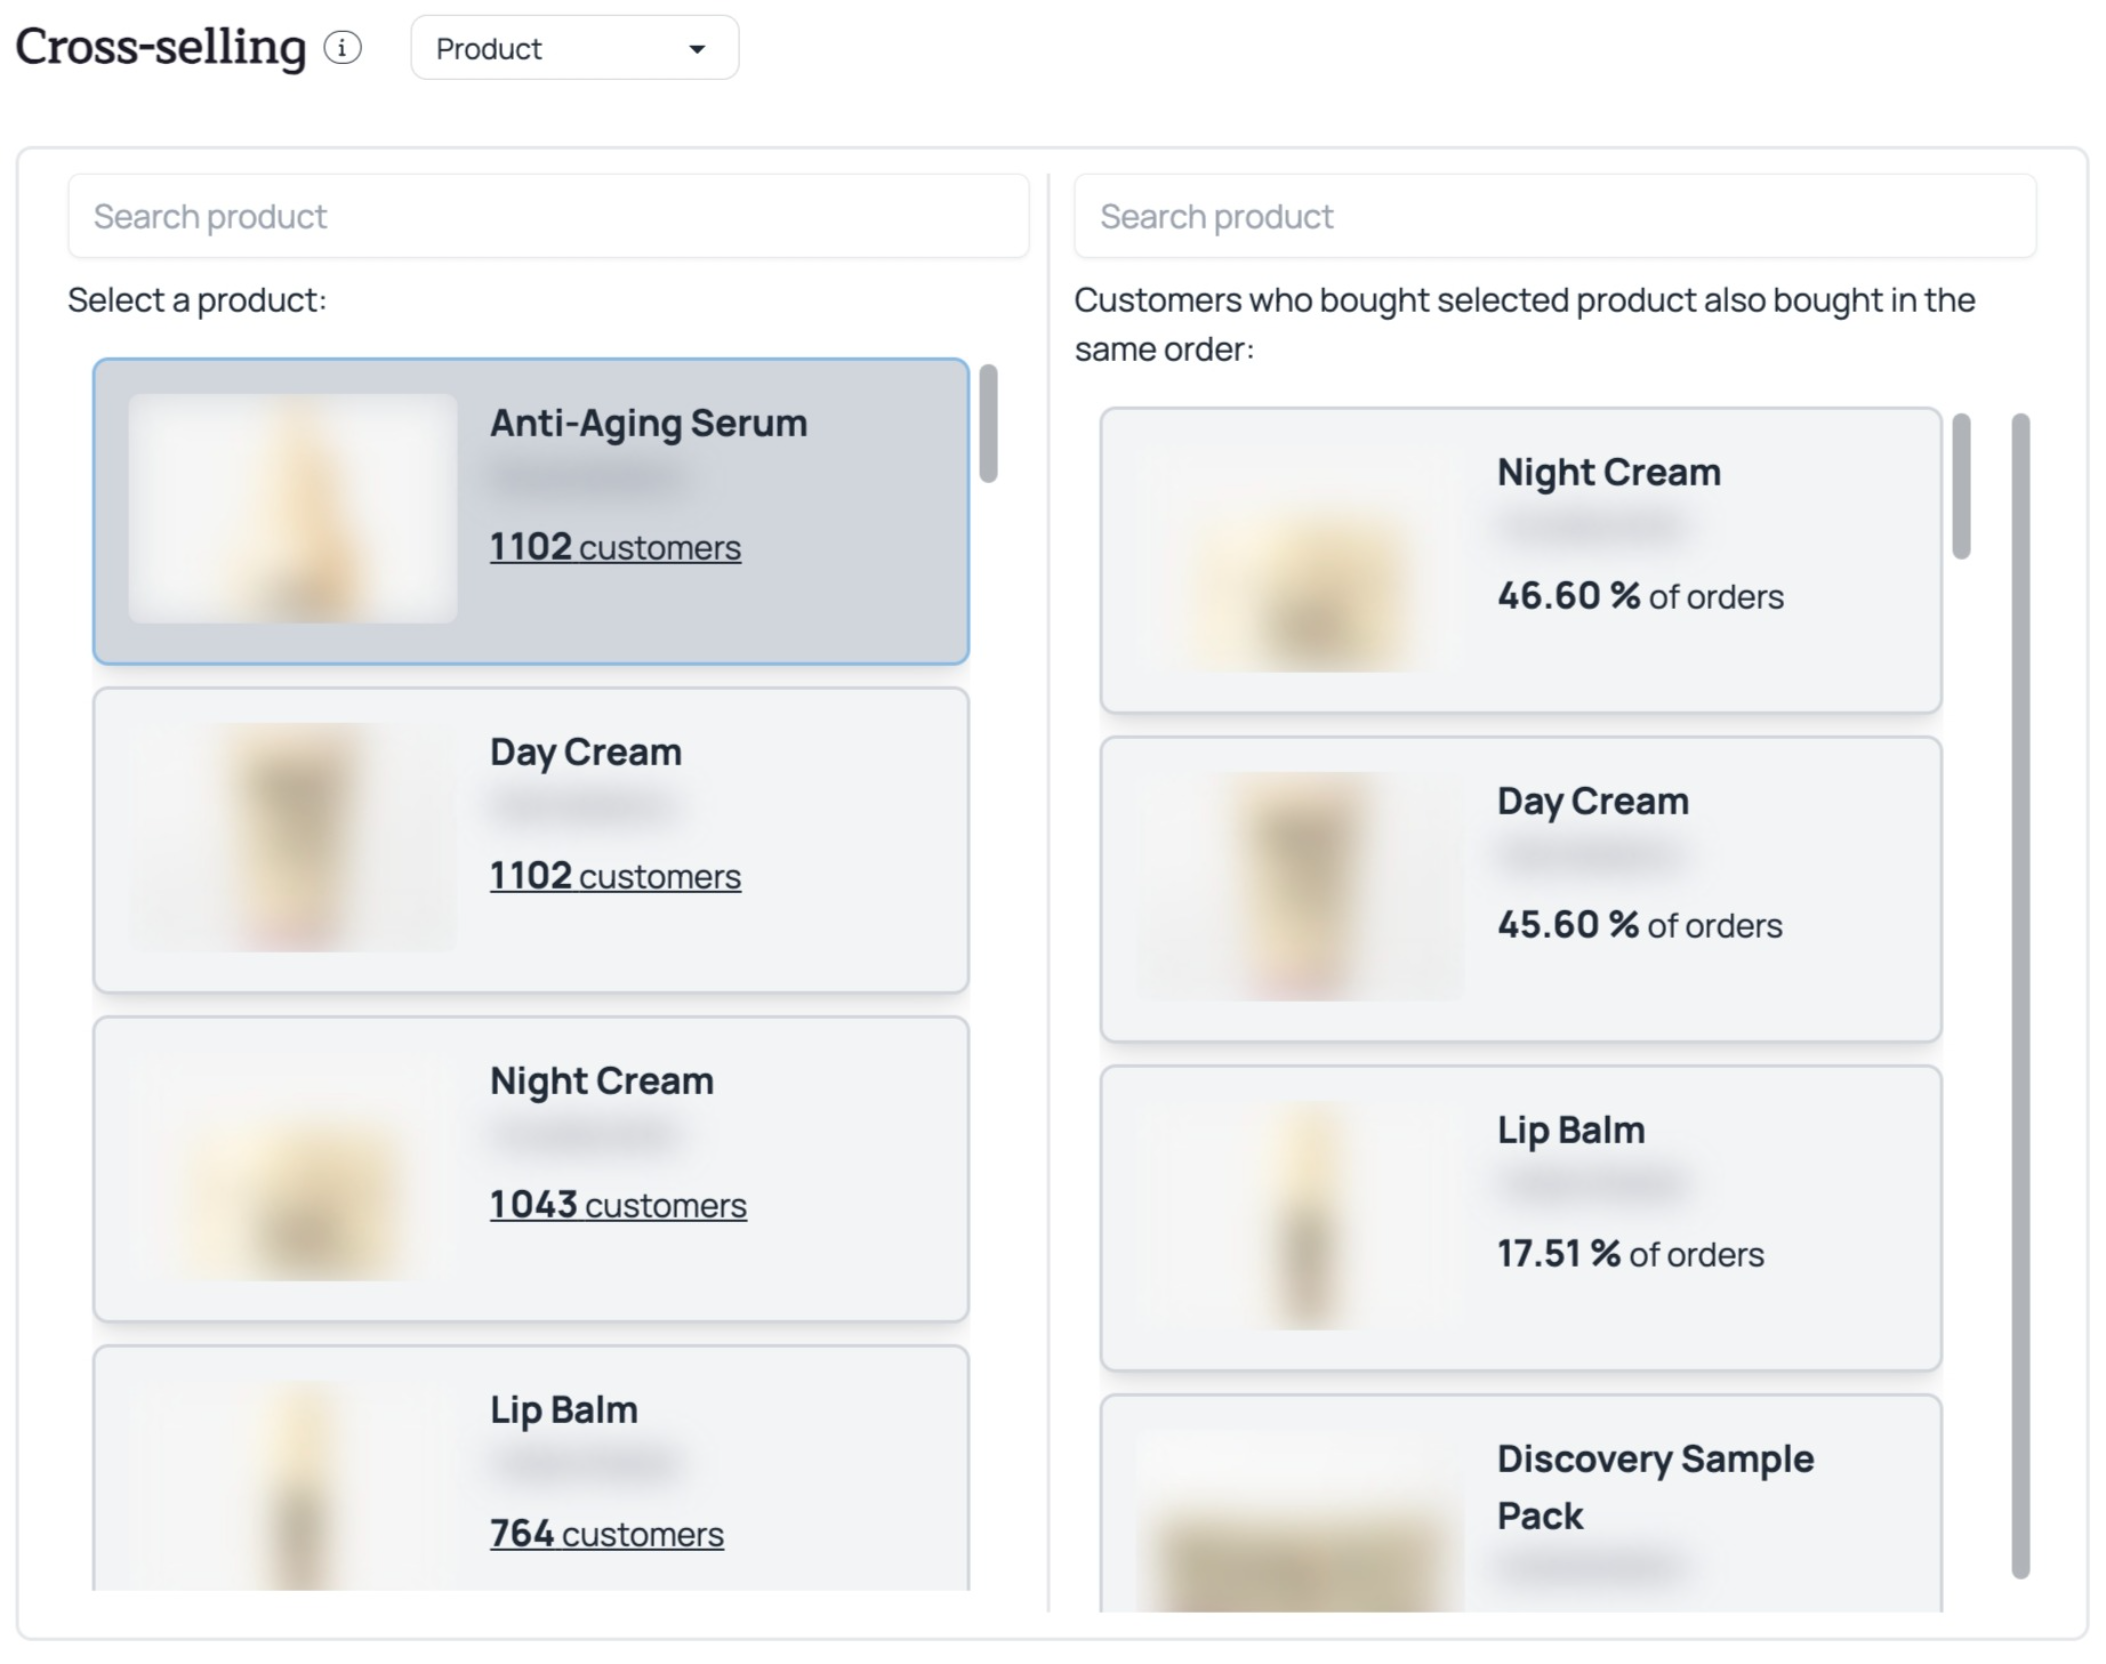
➕ Cross-Selling: Boost the Value of Every Order
Kuma leverages your Shopify order data to identify frequently purchased-together products. By selecting an item in the interface, you instantly see the winning combinations—the product pairs or sets that generate the most joint sales.
These insights help you set up high-impact, personalized cross-sell strategies, directly aligned with your customers’ actual buying habits.
Here’s how to apply these insights in your marketing:
- 🛒 Display dynamic recommendations on product pages with commonly paired items;
- 🎁 Create smart bundles or promo packs based on the most popular combinations;
- 📩 Launch targeted post-purchase emails suggesting complementary products at the right moment;
- 🧠 Optimize your offers by relying on co-purchase data instead of gut feeling.
👉 Kuma-powered cross-selling turns every order into an opportunity for additional sales while making your product recommendations more relevant.
Expected Results from Product Journey Analysis
- Higher retention rates: A better understanding of the product journey enables targeted retargeting, increasing repeat purchases and customer retention.
- Increased average order value and revenue per customer: Cross-sell recommendations based on real data encourage complementary purchases, boosting basket size and order value.
- Time savings and smarter decisions: Analyses are automated and ready for action. You go from data to results without wasting time on manual processing.
Explore More with Kuma
A product journey analysis becomes even richer when combined with advanced customer audience insights.
To deepen this analysis, you can segment your Shopify customer base with the RFM method and identify your top buyers.
FAQ – All About Product Analysis with Kuma
Kuma’s product journey allows you to analyze the purchase paths followed by your Shopify customers. It helps you visualize buying sequences, identify loyalty-driving products, and generate smart recommendations to boost sales and customer retention.
Yes. All product recommendations can be exported in CSV format, making it easy to integrate them into your advertising tools (Meta Ads, Google Ads, Klaviyo, etc.).
Kuma detects products that are frequently purchased together. This allows you to create smart bundles, display personalized suggestions on your product pages, or trigger targeted post-purchase emails. All designed to increase the average order value (AOV).
The recommendations are based on purchase similarities, observed volumes in order history, and frequency of appearance among your most loyal customers. This ensures high-value suggestions, ready to be activated in your marketing campaigns.
Kuma provides the repurchase probability and the average number of days between orders. This information allows you to schedule automated follow-ups at the right time, maximizing your chances of conversion and optimizing inventory management.
The Sankey diagram shows you the sequence of purchases between products, order after order. You can instantly visualize the most frequent flows and identify cross-sell opportunities or underperforming products.