Unified customer data transforms scattered metrics into actionable insights that drive growth, retention, and acquisition efficiency.
Cohort analysis reveals trends hidden by averages, helping to optimize campaigns and increase customer lifetime value (LTV).
Customer journey analytics exposes friction points and moments of delight, allowing for targeted interventions to reduce churn.
Predictive segmentation, powered by AI, enables smarter, timely engagement with high-propensity customer micro-audiences.
Operationalizing insights through dashboards, governance, and automation ensures long-term, measurable business impact.
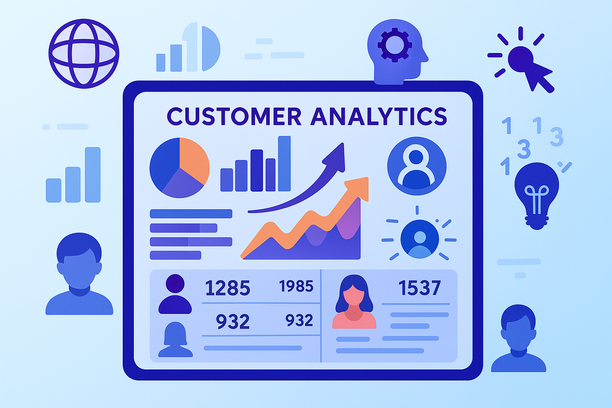
Why Customer Data Matters More Than Ever
Modern marketers are surrounded by data, channel metrics, purchase histories, engagement logs, but, left in silos, these numbers foster guesswork rather than strategy. When integrated and analyzed with the right frameworks, this data answers essential questions:
Which channels generate your highest-value customers?
How quickly can acquisition costs be recovered?
What experiences build loyalty or lead to churn?
The impact is significant: according to Informatica, companies that excel at using customer data for personalized experiences can boost revenue by 5–15% and cut acquisition costs by up to 20%. These numbers soar further when AI segmentation, retention playbooks, and cross-channel personalization are in play. Platforms like Kuma make these techniques accessible for Shopify brands, but the mindset and methods work for any stage of business.
Laying a Solid Data Foundation
Data analysis always starts with a firm foundation. Typically, customer data breaks down into four types, each answering a distinct question:
Personal data: Who is the customer? (Email, location, payment method)
Interaction data: Where and how do they engage? (Email opens, ad clicks, site visits)
Behavioral data: What do they do? (Product views, orders, support requests)
Attitudinal data: Why do they feel the way they do? (Reviews, NPS, social sentiment)
Before any advanced analysis, invest in cleaning and connecting these data points. Deduplication, time-stamping, and regular audits are crucial, every dashboard is only as accurate as its source. Set up weekly or monthly hygiene routines and enforce access controls. When Shopify orders can “talk” to your email analytics, you stop analyzing isolated channels and start interpreting the whole customer system.
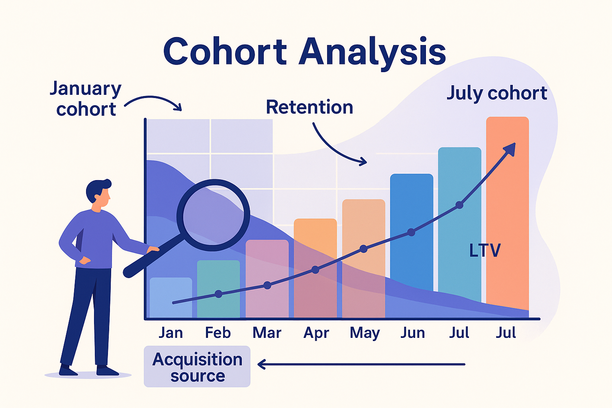
Cohort Analysis: Seeing Time as Your Secret Dimension
Averages obscure reality; cohort analysis, breaking users into groups by shared start points, reveals hidden patterns over time.
For example, grouping first purchases by month, a home-decor brand discovers January customers retain 15% better than July’s. Digging deeper, July’s cohort came via deep-discount ads, once addressed, July’s cost of acquisition (CAC) drops by 18% and downstream LTV rises. That’s the power of aligning marketing spend with true customer quality.
Effective cohort analysis hinges on three guiding questions:
Definition: What’s the shared event, first order, signup, etc.?
Metric: What are you tracking (retention, LTV, renewal)?
Action: What change will you make if the metric drifts?
Today, advanced cohort dashboards (like those in Kuma) automate tracking, instantly syncing segments to ad platforms for targeted look-alike campaigns. No more manual CSVs, just actionable, real-time targeting of your highest-value groups.
Customer Journey Analytics: Mapping Moments That Matter
If cohort analysis delivers the when, customer journey analytics uncovers the where and how, connecting touchpoints into a single customer story. A typical e-commerce journey traverses nonlinear stages:
Awareness: Discovering via social/influencers
Consideration: Reading reviews, comparing
Purchase: Checkout and payment
Retention: Unboxing, follow-up emails
Advocacy: Posting reviews, referring friends
Mapping these reveals friction: according to a TechTarget primer, adding a single field to checkout can double abandonment. Pairing event data (did not complete checkout) with feedback (“payment was confusing”) helps teams tackle the root cause.
Advanced journey engines, like Kuma’s, use AI segmentation (based on recency, frequency, value, and more) to predict risk or opportunity. If a high-value customer’s behavior signals churn, say, repeated return-policy views, a real-time incentive can be triggered, saving the relationship (and revenue) before it’s lost.
Advanced Segmentation and Predictive Modeling
Once you master time-based cohorts and journey mapping, level up to predictive segmentation. The classic RFM matrix, recency, frequency, monetary, becomes exponentially more powerful when layered with machine learning.
Today’s AI-driven tools analyze dozens of signals beyond just frequency or spend: category preference, device type, return sensitivity, and more. You may spot new behavioral “clusters”, like “weekend mobile skincare buyers who repurchase in 45 days.” Marketers can immediately engage these micro-segments with perfect-fit messaging.
Predictive models also drive retention. By studying past behavior, AI forecasts who will buy again soon, or who is likely to churn. Set thresholds (like less than 12% chance of reordering this month) to trigger win-back campaigns automatically, all while suppressing unnecessary discounts to higher-propensity buyers.
Turning Insight into Action: The Operational Playbook
Analysis isn’t the goal; action is. Here are four proven playbook moves that transform data into measurable revenue:
Acquisition Efficiency: Find and feed your best cohorts into ad-platform look-alikes, lowering CAC and accelerating payback.
Personalised Merchandising: Journey mapping exposes product affinities, use those to trigger tailored upsells or cross-sells, raising AOV fast.
Churn Intervention: Use predictive scores to spot at-risk buyers and hit them with timely incentives, well before they lapse.
Long-Term Loyalty Loops: Automate gratitude and perks for advocates. Recognition builds an army of repeat buyers and brand defenders, shrinking future ad costs.
In all cases, timing and personalization are everything, the right trigger at the right moment makes the difference between recovered revenue and wasted effort.
Measurement and Governance: Keeping Score
Make your wins and opportunities visible. Set up dashboards linking campaigns to north-star customer metrics:
Retention Rate: (Customers at End ÷ Customers at Start) – New Customers
Marry these customer metrics to acquisition reporting (ROAS, CPA) so Marketing and Finance are always in sync. Regularly revisit your data models, market trends change, data drifts, and old signals can go stale. Schedule quarterly or biannual audits to keep your analysis sharp.
Putting It All Together
Great analysis marries the artistry of storytelling with statistical discipline. Use cohort tables to uncover how groups evolve; journey maps to highlight the “why” behind every click; and predictive segments to engage each customer as an individual, because, with the right data, you essentially do.
Whether you leverage Kuma’s AI assistant or use manual methods, the mindset is universal: treat data as an ongoing conversation with your audience, not a file to close by day’s end.
Brands that embrace this holistic strategy consistently beat competitors on growth, loyalty, and customer satisfaction. Those who delay are left chasing vanity metrics, overspending on acquisition while competitors build genuine long-term relationships at scale.
Ready to Turn Data into Revenue?
Are you ready to transform disconnected Shopify customer data into predictive audiences, orchestrated journeys, and profit-driving campaigns? Kuma’s AI-powered assistant integrates directly with Shopify, Meta Ads, Google Ads, Klaviyo, and more, no developers required. Book a demo now to see how easy it is to start building cohorts, journeys, and segments that truly move the revenue needle.
FAQ – Understanding Customer Data
What is cohort analysis and why does it matter?
Cohort analysis groups customers by a shared starting point, such as “first purchase month”, then tracks their behavior over time. This approach uncovers differences in retention, lifetime value, or repeat rates that averages often conceal. For example, you might discover that customers acquired during major sales events retain less well than those from organic channels, allowing you to refine your targeting or messaging.
How do customer journey analytics improve marketing results?
Customer journey analytics connect every touchpoint (ads, site visits, emails, purchase, reviews) into a holistic view. This mapping highlights friction points, like confusing checkout or slow post-purchase emails, so you can act quickly to improve experiences, reduce churn, and increase average order value.
What’s predictive segmentation and how is AI involved?
Predictive segmentation uses data, including recency, frequency, spend, device, and more, to identify customers most likely to perform certain actions. AI models can spot complex behavioral clusters and even predict who will buy, refer, or churn, allowing marketers to automate personalized campaigns and protect margins.
Why is data cleaning and governance so important before analysis?
Without clean, connected, and time-stamped data, your insights will be inaccurate or even misleading. Routine cleaning, deduplication, and access management ensures the integrity of your dashboards and automations, preventing costly mistakes as your analytics grow.
How can brands use these insights without custom engineering?
Solutions like Kuma connect directly to platforms like Shopify, Meta Ads, and Klaviyo, automating the entire workflow, data cleaning, cohort building, journey mapping, and predictive segmentation, without engineering support.