Advanced Customer Analysis: Distribution, Retention, Cohorts
Why Is Customer Analysis Essential for a Shopify Website?
For any e-commerce merchant, deeply understanding who your customers are is no longer optional—it’s a condition for sustainable growth. Here’s why customer analysis has become a strategic pillar for Shopify stores:
- Optimize every dollar invested
By identifying high-potential segments, you maximize your ROAS (Return on Ad Spend) by targeting the right profiles, at the right time, with the right message. - Make data-driven decisions
With an integrated analytics dashboard, you get real-time access to key metrics: average customer value (CLV), retention rate, purchase frequency, buying behavior, and other insights to adjust your marketing strategies. - Smart customer segmentation
Using dynamic customer segmentation (via RFM, cohorts, or behavior) lets you tailor offers and messages for each customer type, increasing relevance and impact. - Identify loyalty and reactivation levers
A clear view of RFM distribution and customer lifecycles helps prioritize efforts: who to retarget, who to reward, and who’s at risk of churning. - Anticipate buying trends and prevent churn
By tracking customer cohorts over time, you visualize how your actions perform and detect early signs of disengagement. - Better understand your customers to sell better
This is no longer just a promise—it’s daily practice. With behavioral analysis of your buyers, you turn raw data into concrete, profitable actions.
How Does Customer Analysis Work in Kuma?
Customer analysis in Kuma relies on an intelligent reading of your Shopify data: orders, behaviors, loyalty status, and more are processed to give you an actionable view of your customer base. At a glance, you get a strategic summary to help you make the right decisions at the right time.
Visualize Your Audience Performance
The Kuma dashboard centralizes key metrics to help you better understand your Shopify customers and steer your marketing campaigns. It helps you track customer value, loyalty, and each audience’s contribution to your results.
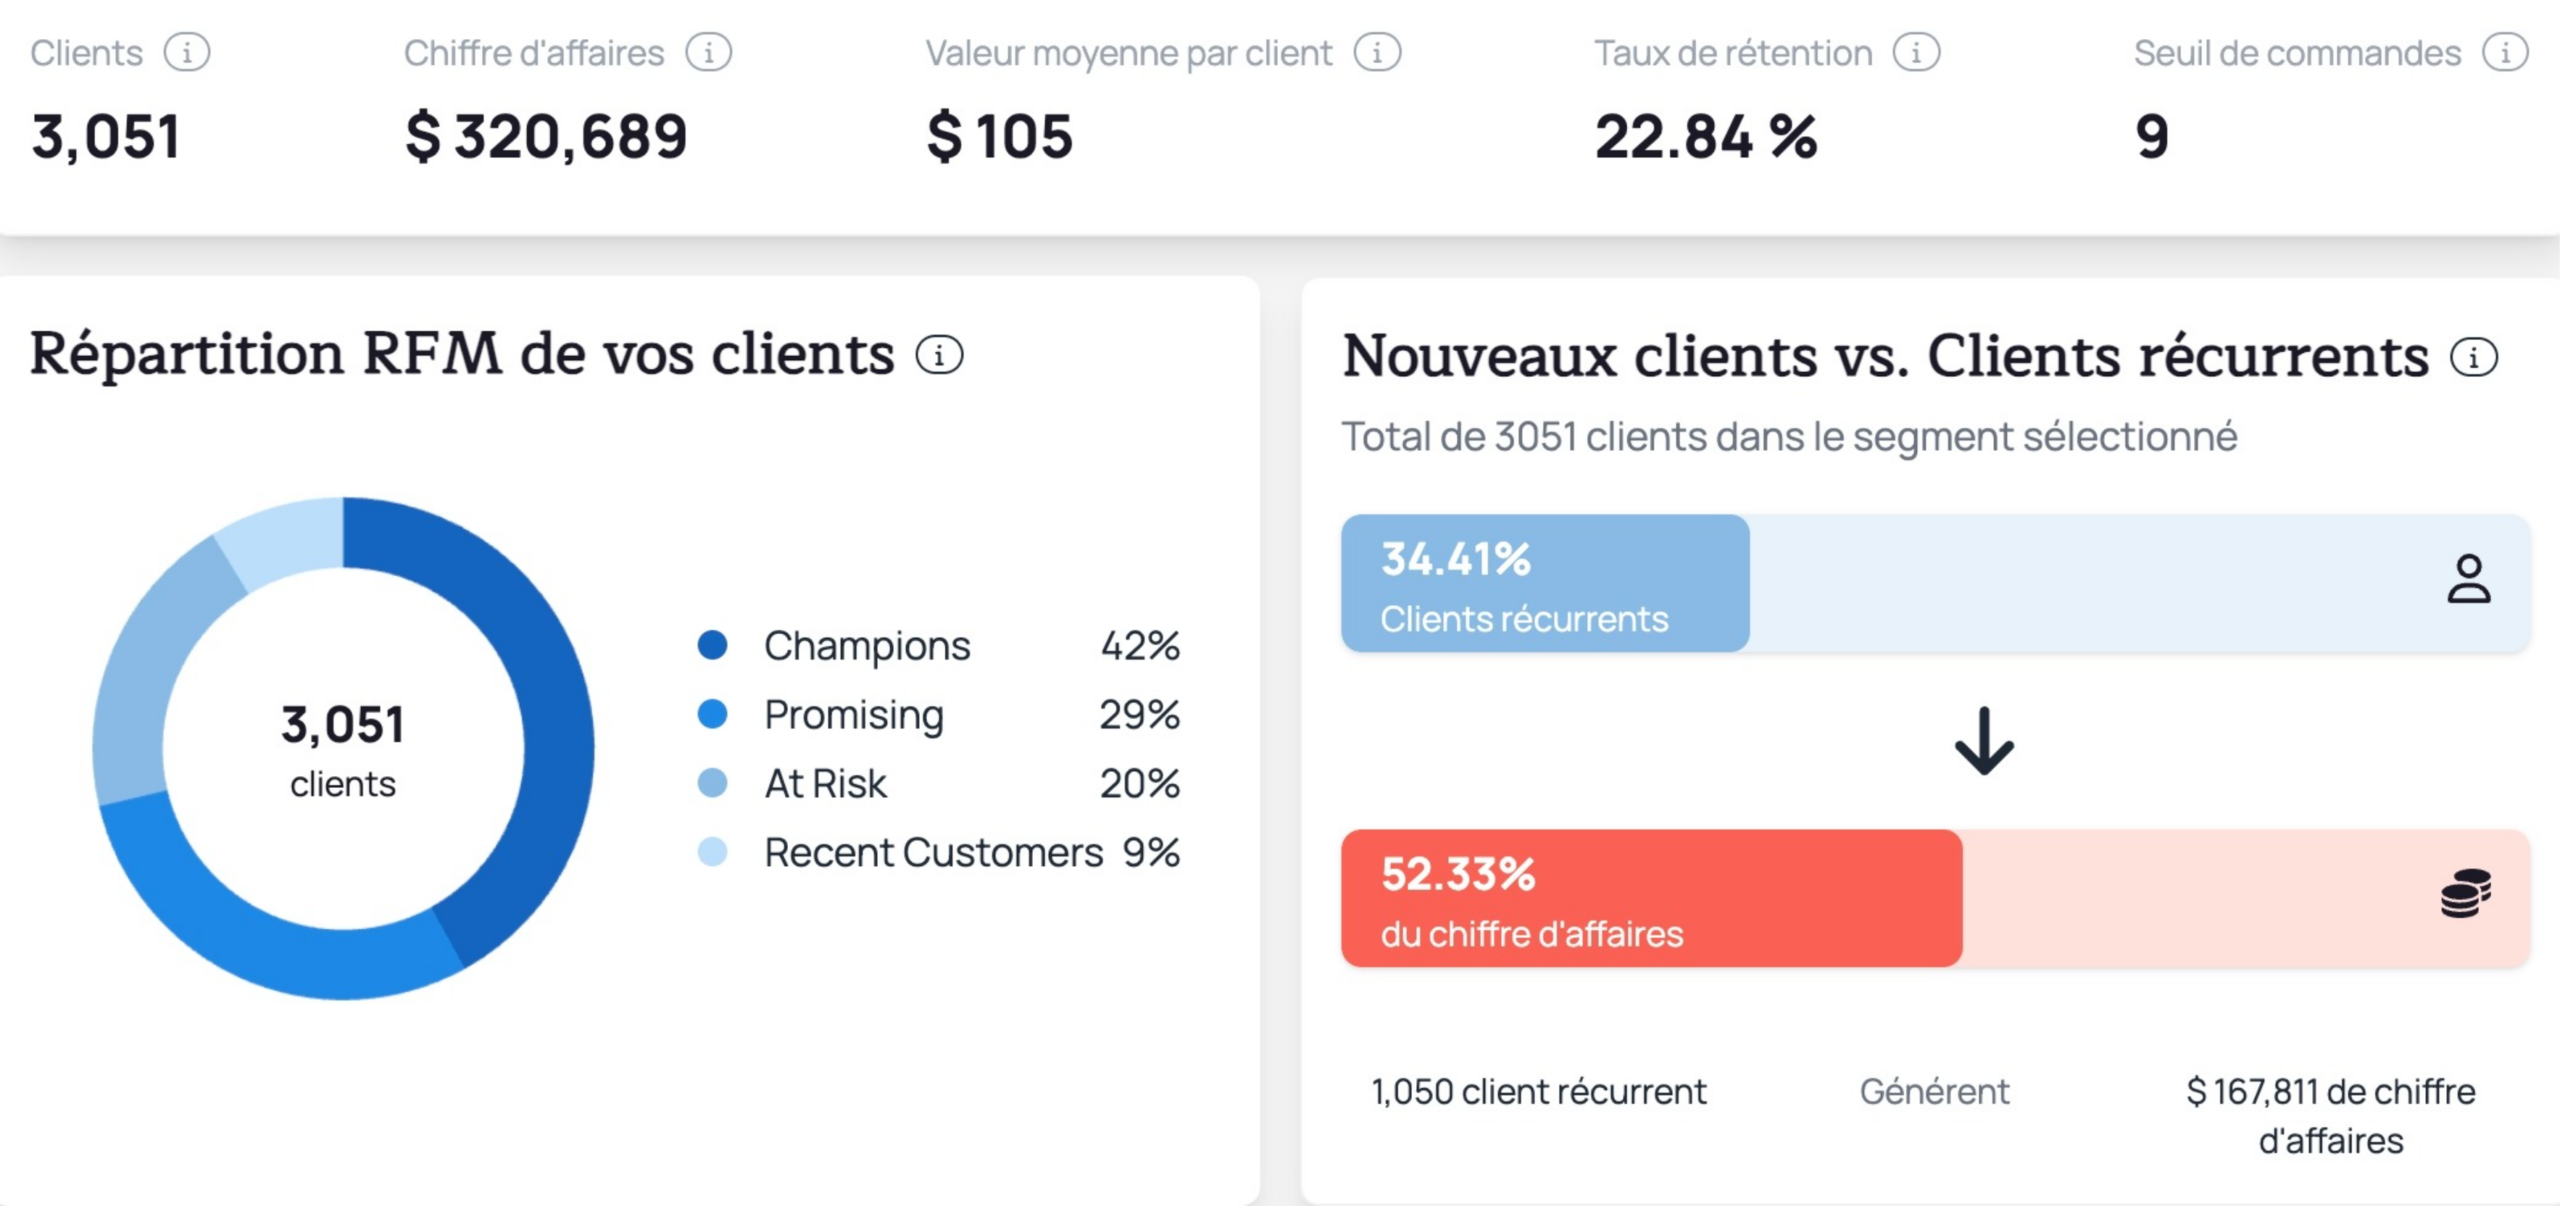
Overview:
- Number of customers: shows the audience size analyzed.
- Revenue generated: indicates sales attributed to this group.
- Average value per customer: shows the average spend per customer in the segment.
Loyalty metrics:
- Retention rate: measures the percentage of returning customers.
- Order threshold: identifies the number of purchases after which a customer is considered loyal.
RFM segmentation: The RFM chart groups your customers by engagement and potential value. It’s an essential tool for quickly identifying your audience’s potential and understanding who you’re addressing.
New vs. repeat customers: This visualization compares the weight of new customers vs. repeat customers in volume and generated revenue. It helps guide decisions between acquisition and retention.
Analyze Customer Loyalty Over Time with Cohort Analysis
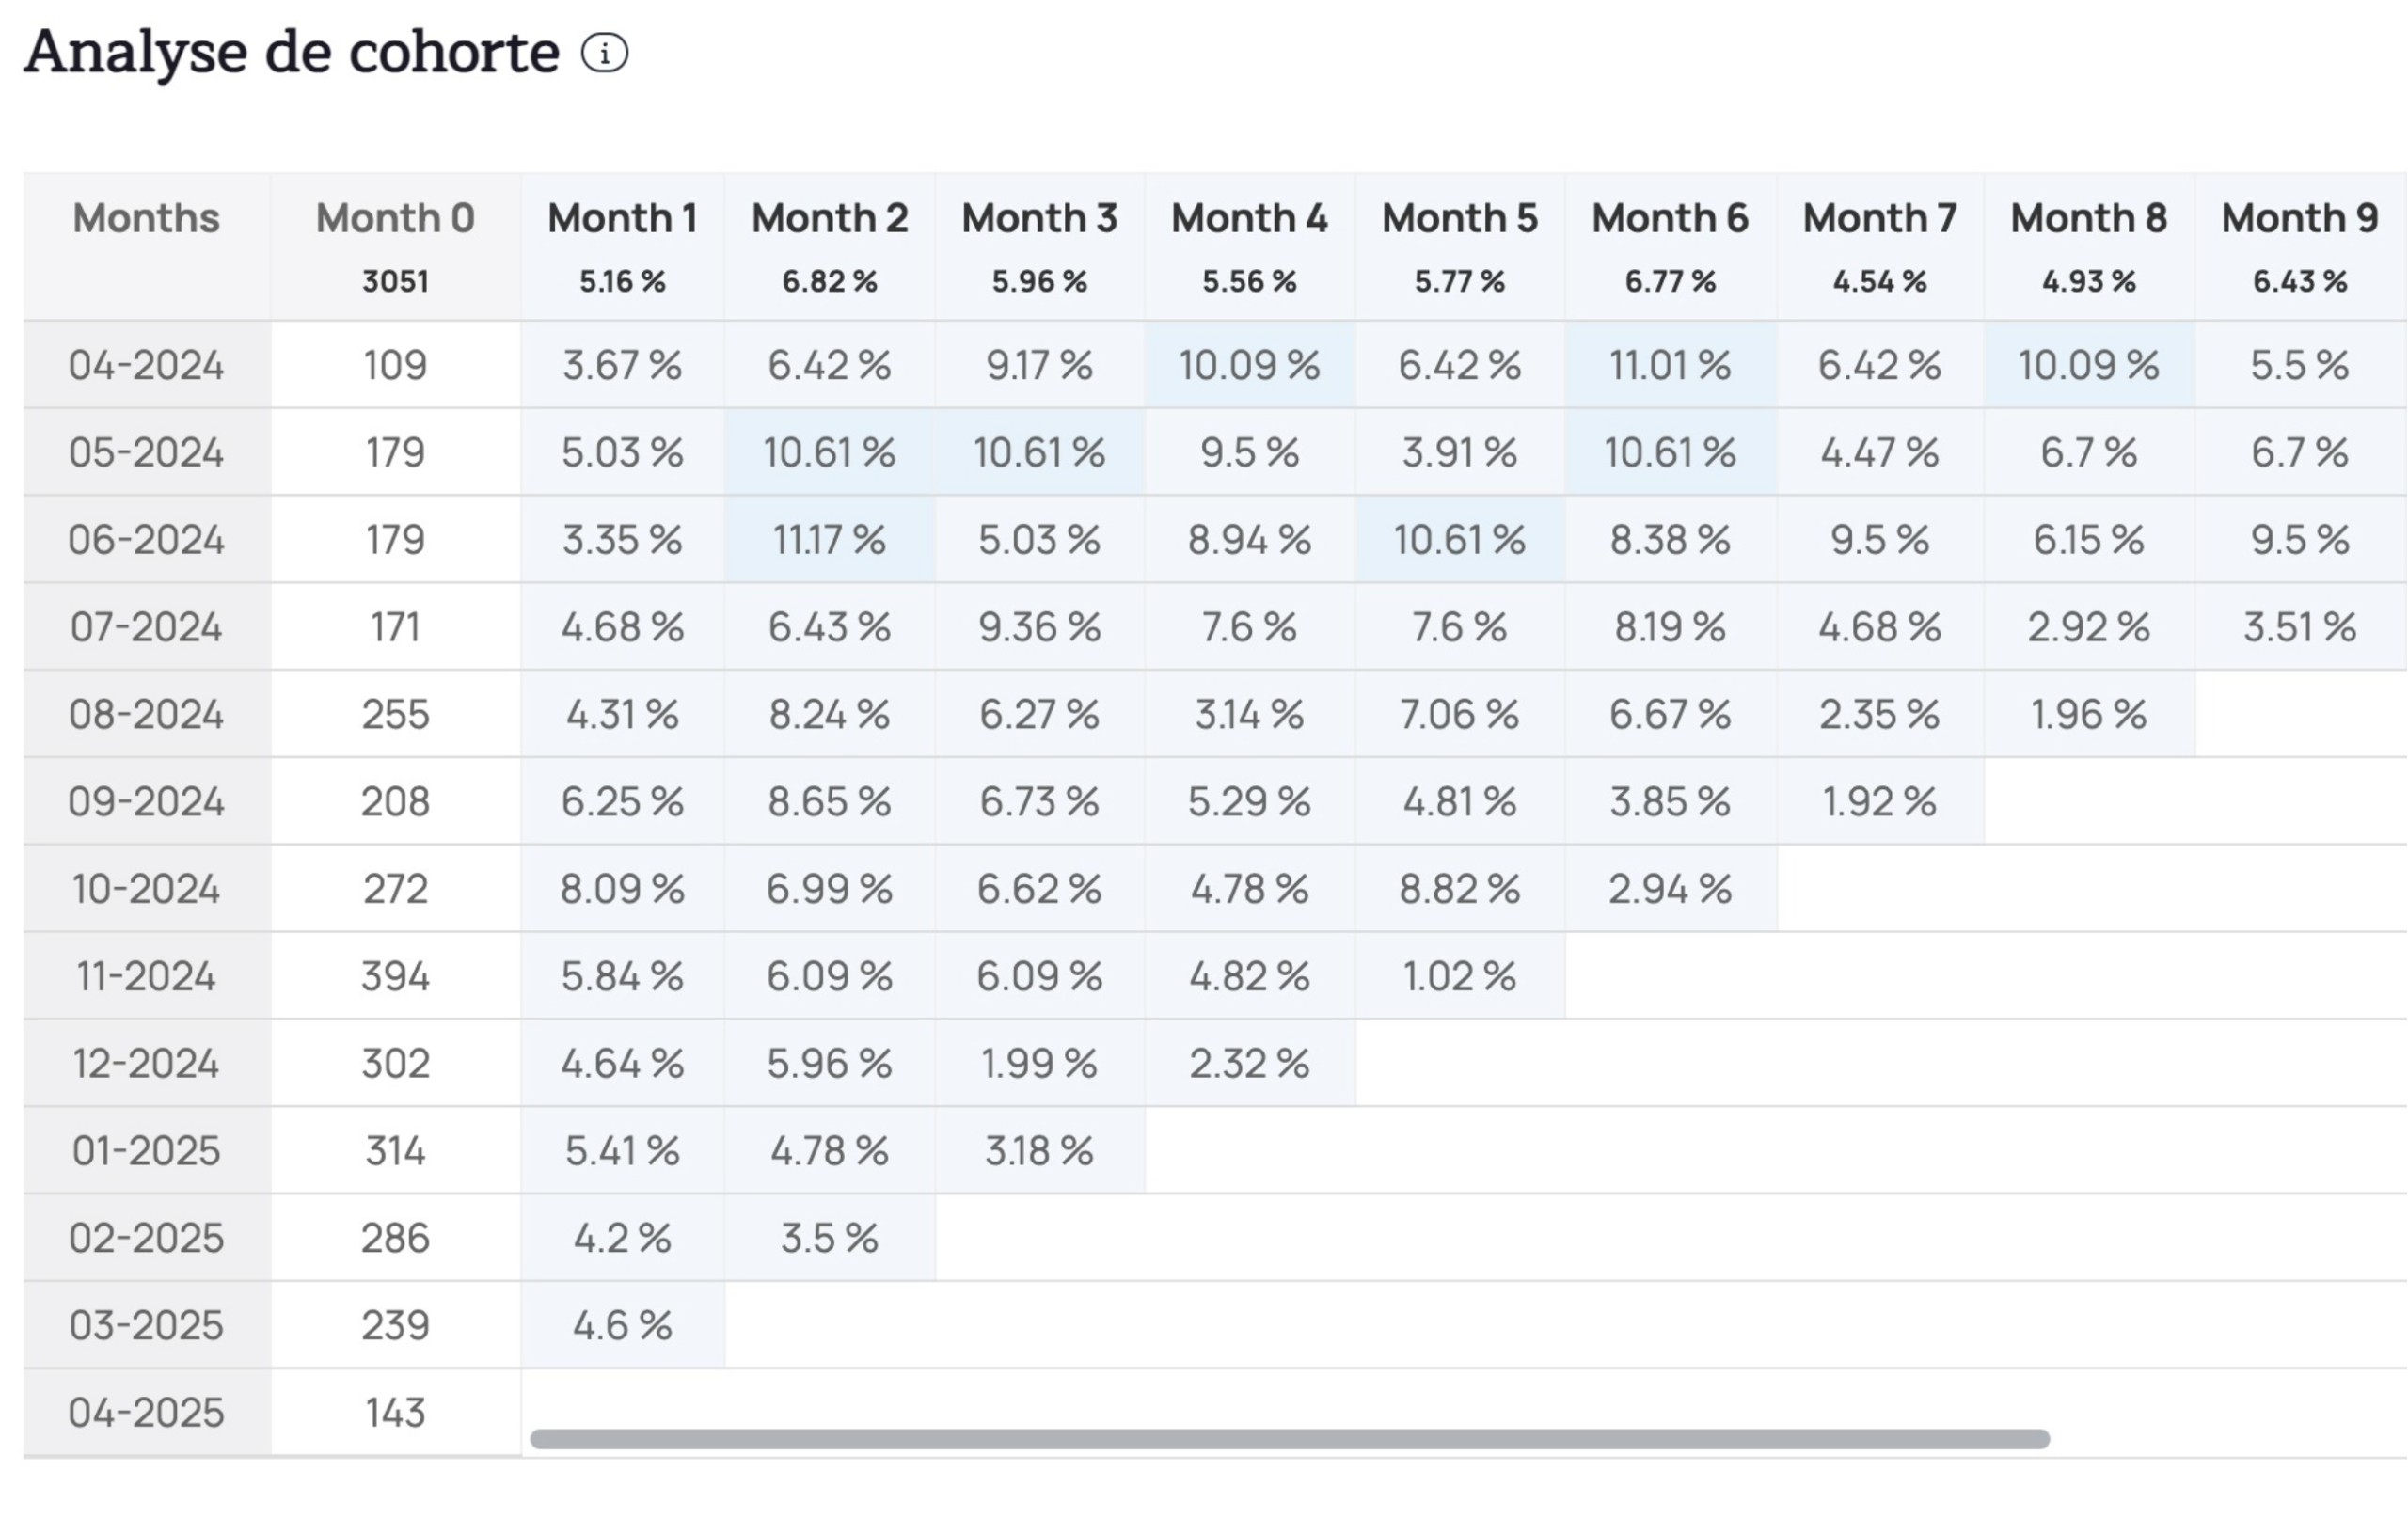
Cohort analysis helps you understand how customers evolve over time after their first purchase. Kuma groups customers by acquisition month and tracks their behavior in the following months to detect repeat purchase trends and drop-off points.
In the cohort matrix, each row represents an acquisition month. Reading left to right, you see the percentage of repeat customers over time, helping you identify when customers become loyal or when they stop buying.
With this visualization, you can:
- Measure real customer loyalty over several months
- Identify your most promising or at-risk cohorts
- Spot critical months where marketing reactivation can make a difference
- Assess the impact of campaigns (promotions, product launches) on buying behavior
Unlike global stats, cohort analysis highlights the specific dynamics of each customer group. It’s a valuable tool for refining your loyalty strategy and improving customer lifetime value.
Track Acquisition and Predict Customer Loyalty
To effectively monitor your e-commerce growth, it’s essential to understand both your new customer acquisition rate and their likelihood of repeat purchase. Kuma helps track both with smart visualizations.
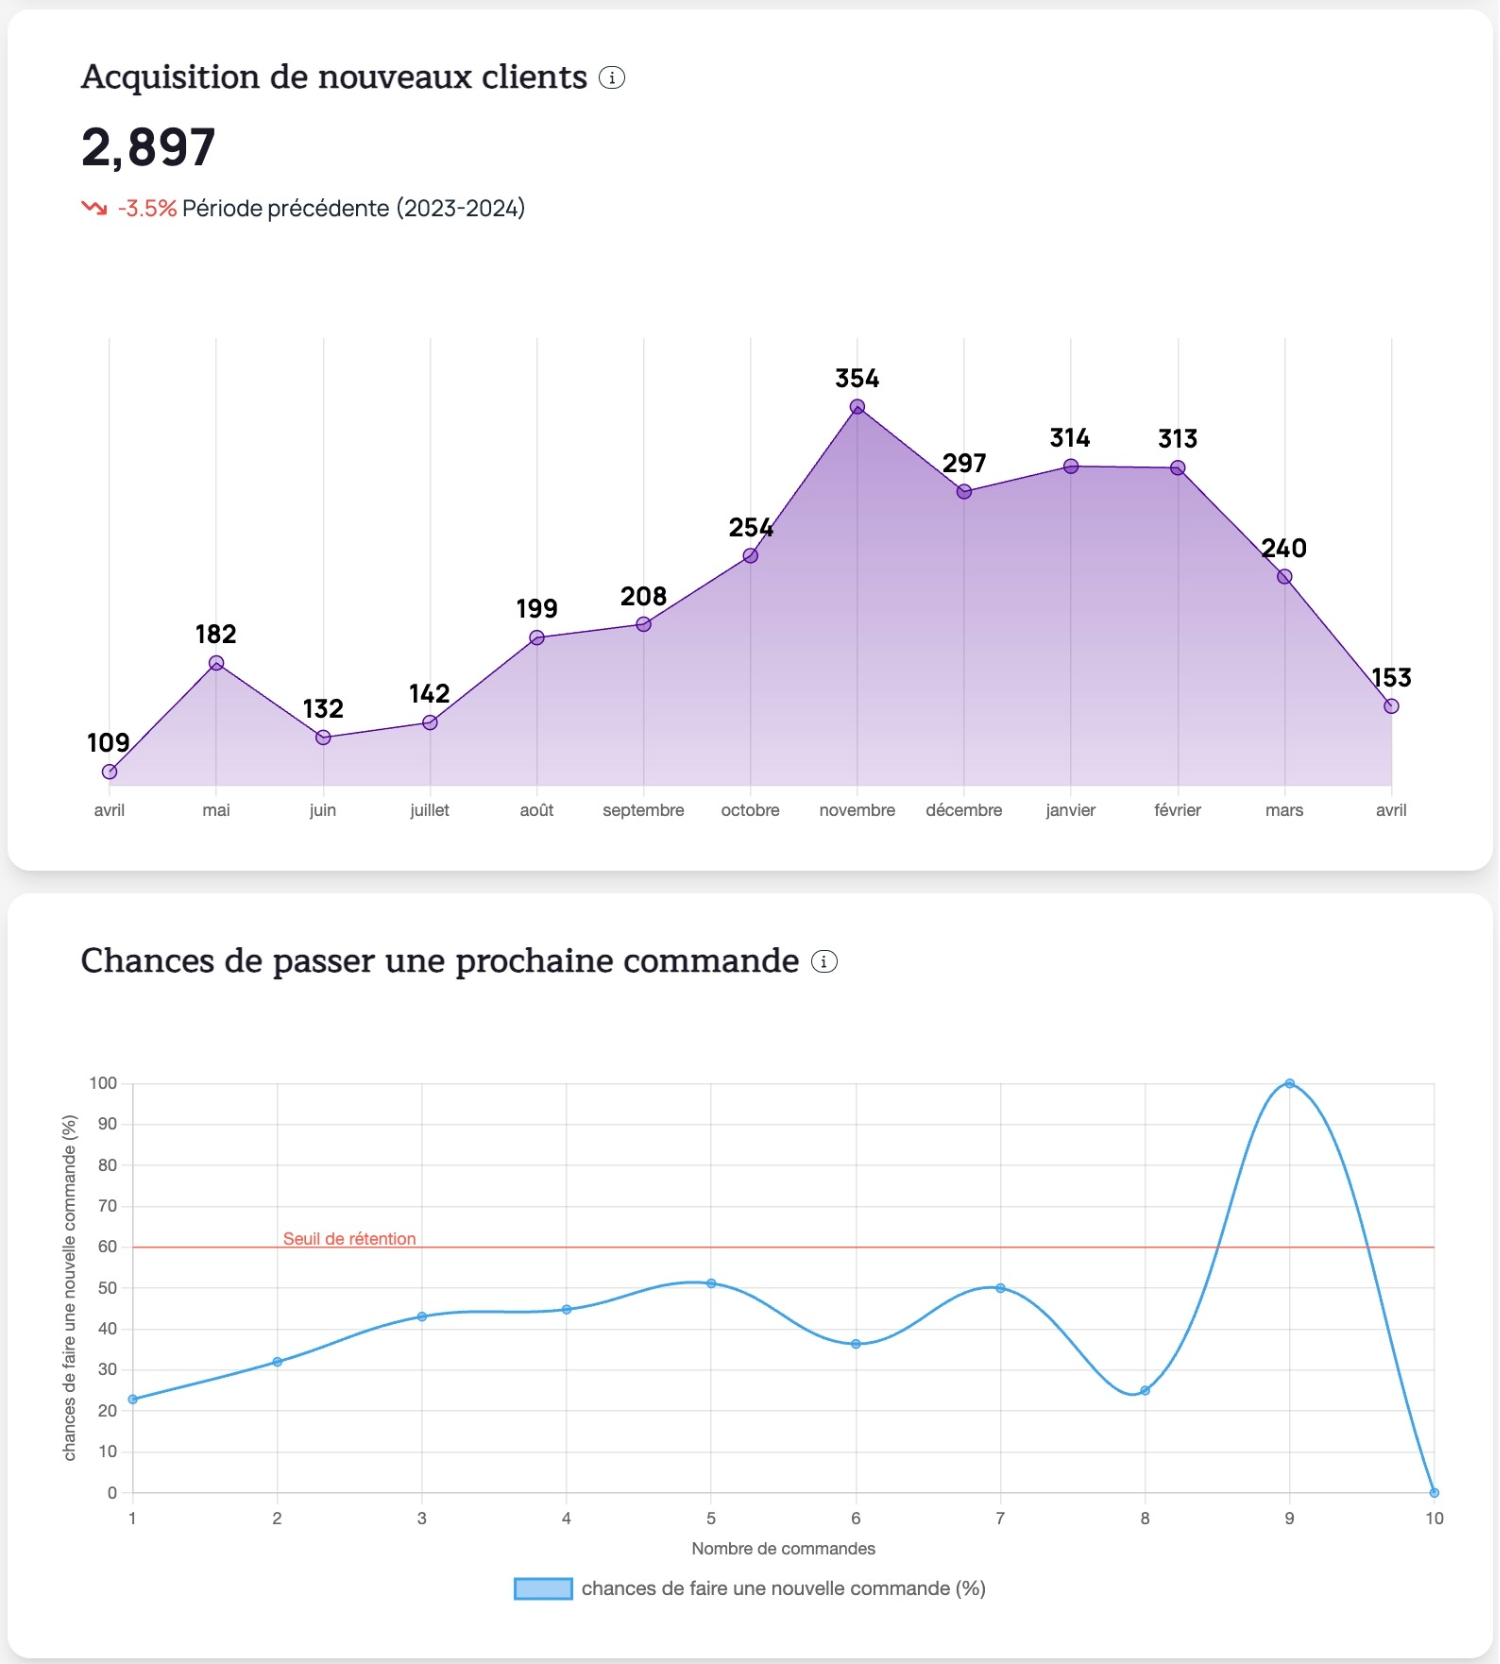
New customer acquisition: The curve chart shows the number of new customers acquired each month, allowing you to:
- Identify seasonality in acquisition
- Measure the impact of ad campaigns or product launches
- Compare year-over-year performance
This tracking is a great starting point to adapt your customer acquisition strategy to the most effective periods.
Next-order probability: This chart shows the repurchase probability based on the number of past orders per customer.
A retention threshold line helps you spot the critical moment when a customer becomes meaningfully engaged. In short:
- Before the threshold: the customer is still fragile, in the activation phase
- After the threshold: loyalty chances increase sharply
This analysis is especially useful for:
- Setting a clear goal for customers (e.g., aim for the 3rd purchase)
- Activating automated marketing at strategic moments
- Optimizing retention campaigns with perfect timing
With these tools, you measure both your ability to acquire new customers and turn them into loyal buyers—a solid foundation for sustainable growth.
Expected Results from Customer Analysis
By combining Kuma’s various customer analysis modules—RFM segmentation, cohort analysis, retention, repurchase probability—you turn your Shopify data into concrete growth levers. Here’s what you can expect:
- Increased repeat purchase rate: by identifying customers near the loyalty threshold, you trigger the right marketing levers at the right time.
- Improved ROAS: your campaigns target high-potential segments, optimizing every dollar spent.
- Reduced churn: cohort and at-risk customer visualizations help you detect inactivity and act before it’s too late.
- Long-term loyalty: predictive audiences help build an engaged customer base with higher lifetime value.
- Data-driven marketing decisions: you steer actions not by gut instinct, but with clear, reliable, and actionable indicators.
These results help Shopify merchants gain efficiency, profitability, and peace of mind. You no longer react to customer behavior—you anticipate and influence it.
Explore More with Kuma
It’s highly valuable to analyze your customers’ product journeys to better understand purchasing dynamics within cohorts.
Advanced analysis can also help predict future customer behavior using AI-powered audiences.
FAQ – Everything You Need to Know About Customer Analysis
Customer analysis in Kuma includes several tools to help you better understand your Shopify audiences: RFM segmentation, cohort analysis, retention rate, and repurchase probability. It helps you identify loyal, at-risk, or high-potential customers and adapt your marketing campaigns accordingly.
By analyzing your customers, you improve your ROAS, increase your repurchase rate, reduce churn, and make better marketing decisions. You invest where the impact is strongest: in the most profitable segments of your Shopify audience.
Cohort analysis allows you to track the behavior of a group of customers acquired during the same period. You can visualize their loyalty over time, detect moments of decline, and measure the impact of your retention or reactivation campaigns.
Yes. Kuma’s interface is designed to be accessible for both beginners and advanced users. The analyses are visual, easy to understand, and actionable without technical expertise. Insights are clear and can be activated in just a few clicks.
In Kuma, a customer is considered loyal once they exceed a certain number of orders. Kuma helps you define this threshold based on the historical behavior of your current customers. Once this milestone is reached, the likelihood of frequent future purchases increases significantly.